Purpose
The purpose of this report is to describe and explain how to generate the Positions Vacant-Filled report in the Integrated HR-Payroll System.
Report Description
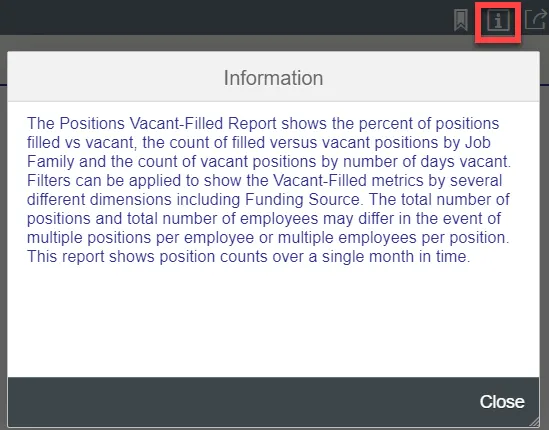
The Positions Vacant-Filled Report is a dashboard that shows the percent of positions filled vs vacant, the count of filled versus vacant positions by Job Family and the count of vacant positions by number of days vacant. Filters can be applied to show the Vacant-Filled metrics by several different dimensions including Funding Source. The total number of positions and total number of employees may differ in the event of multiple positions per employee or multiple employees per position. This report shows position counts over a single month in time.
Report Location
OM: Vacant-Filled Position Analysis
Report Uses
Analyze vacancy metrics to spot potential problem areas and assist in determining a course of action to help with recruitment/staffing.
For example:
- Are there staffing challenges with any specific Divisions?
- Are there particular types of jobs that are consistently showing higher vacancy rates?
- How long are positions remaining vacant?
How to Generate This Report
There are no prompts required to generate this dashboard. Click on the report name “B0194: Positions Vacant-Filled” in the OM: Vacant-Filled Position Analysis folder, and the report will execute.
The dashboard is generated with data contained in multiple tabs.
The initial rendering defaults to showing data specific to the agency OrgUnits for which the user has access.
Overview Tab
Below is a sample of the dashboard charts under the Overview tab:
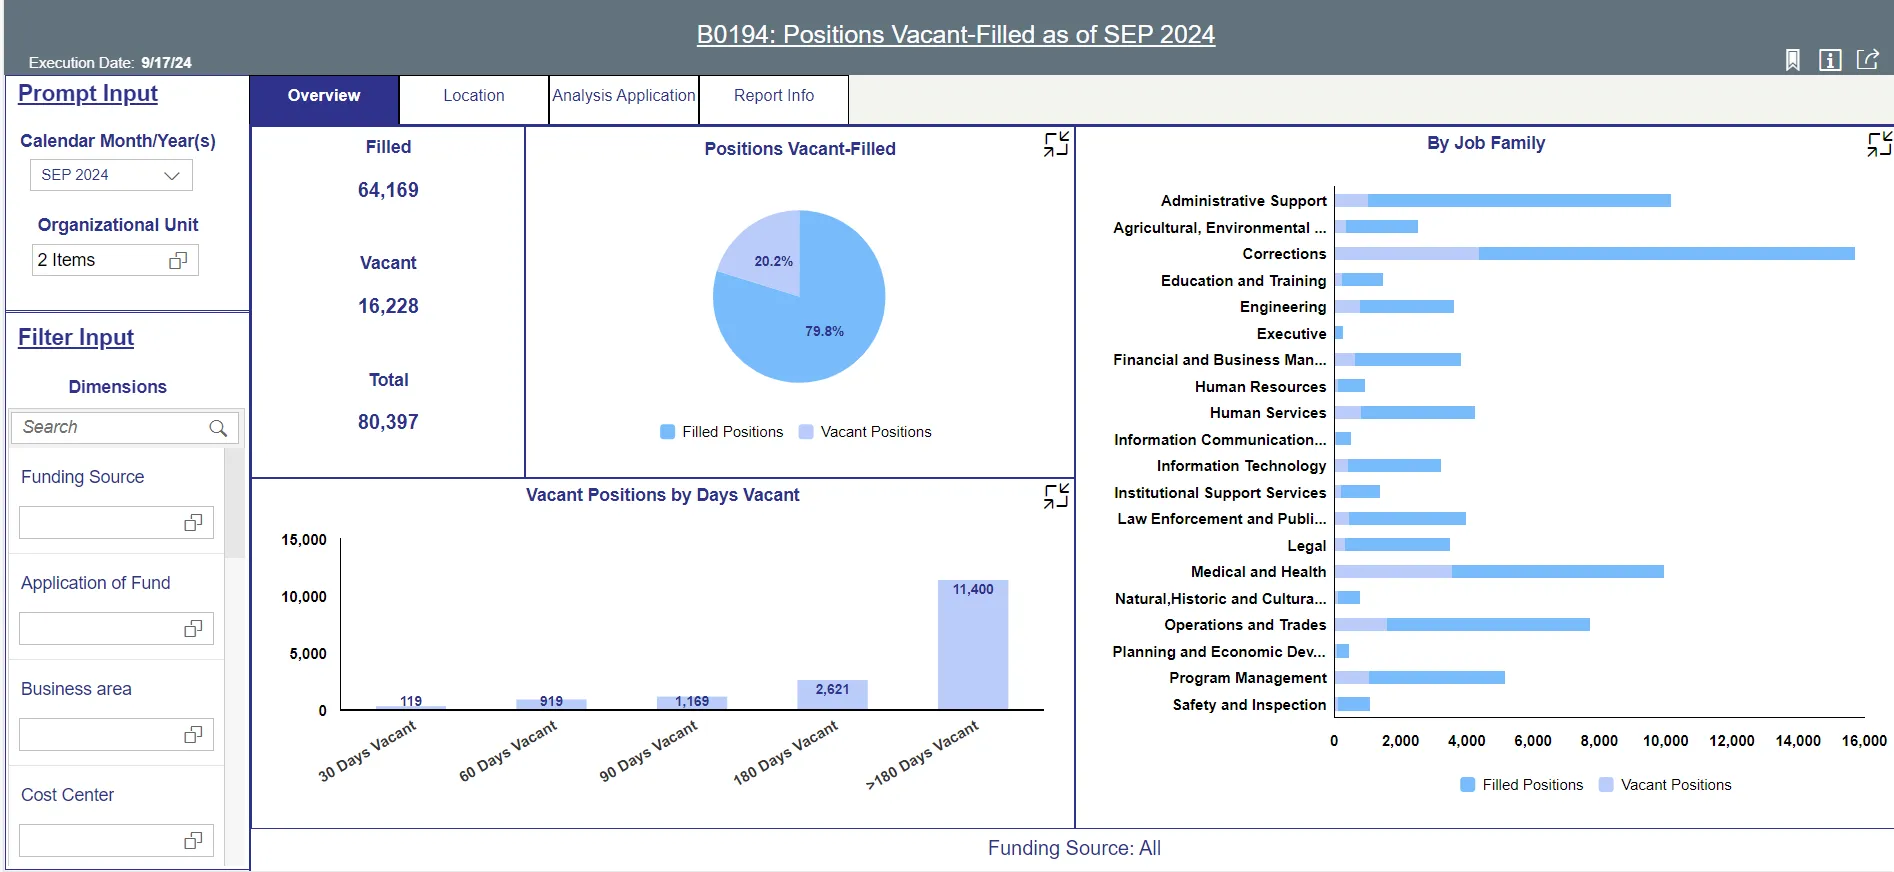
There are four data components displayed in this tab.
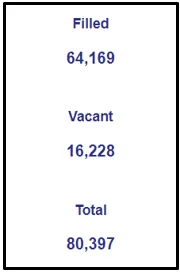
- Text component showing Filled positions, Vacant positions, and Total positions.
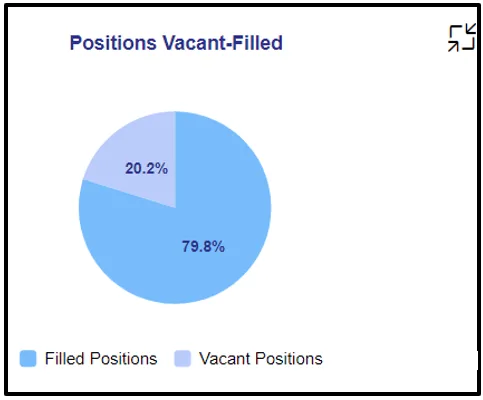
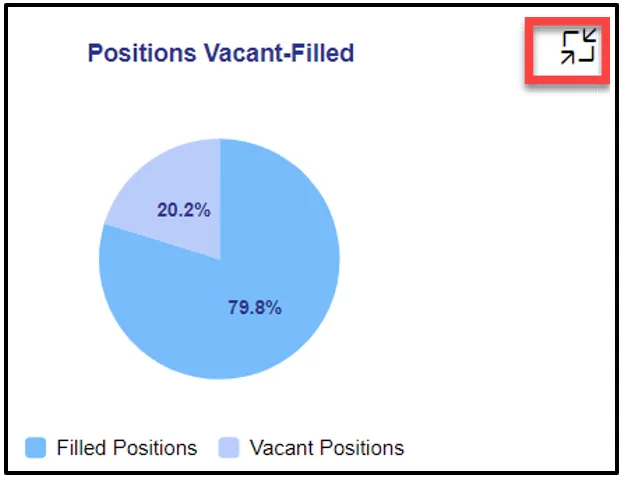
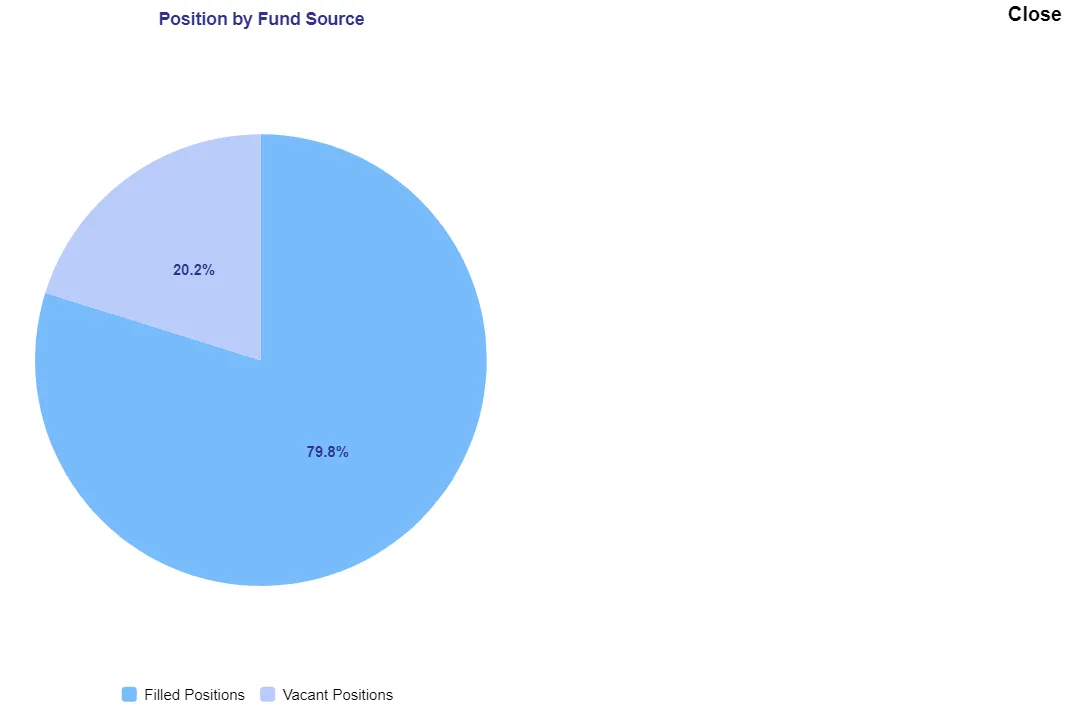
- Pie Chart showing percent Filled vs percent Vacant metrics.
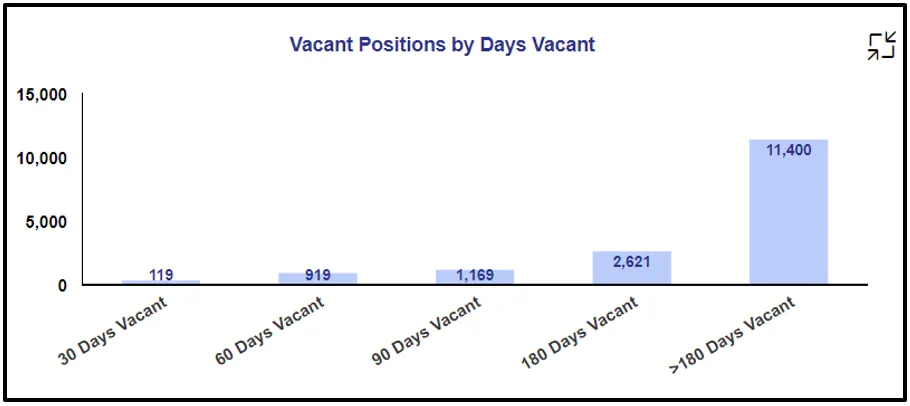
- Vertical Bar Chart showing count of Vacant positions grouped by Number of Days Vacant.
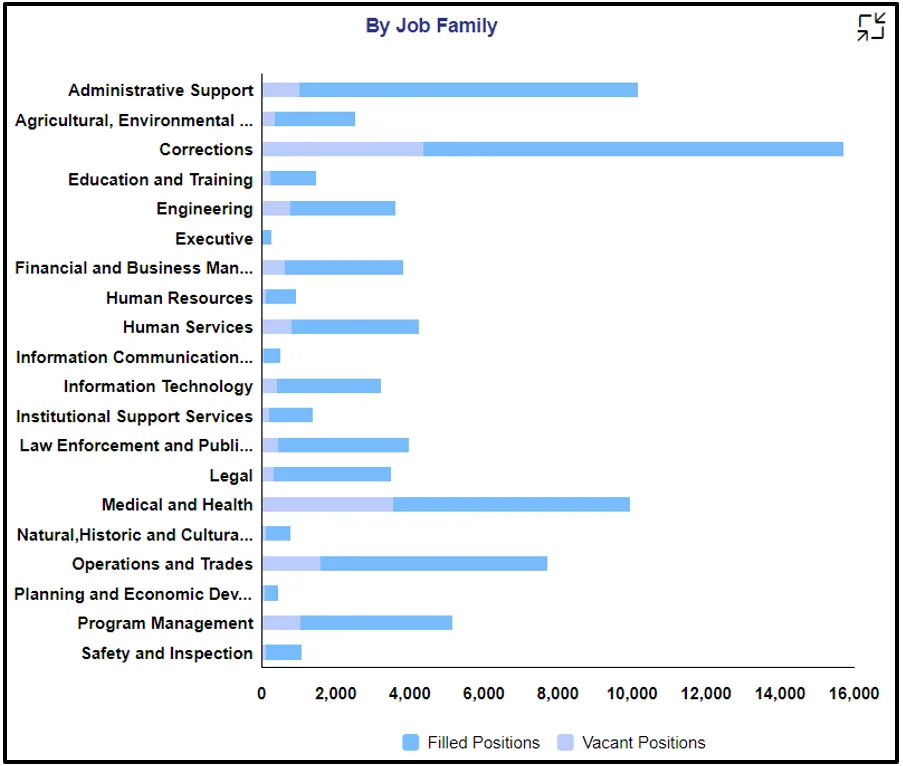
- Horizontal Bar Chart showing Vacant vs Filled metrices by Job Family.
Each chart contains an icon in the upper right corner to enable expansion of the chart to full-screen view.
Location Tab
This tab shows a heat map with vacancy metrics correlated to counties in North Carolina.
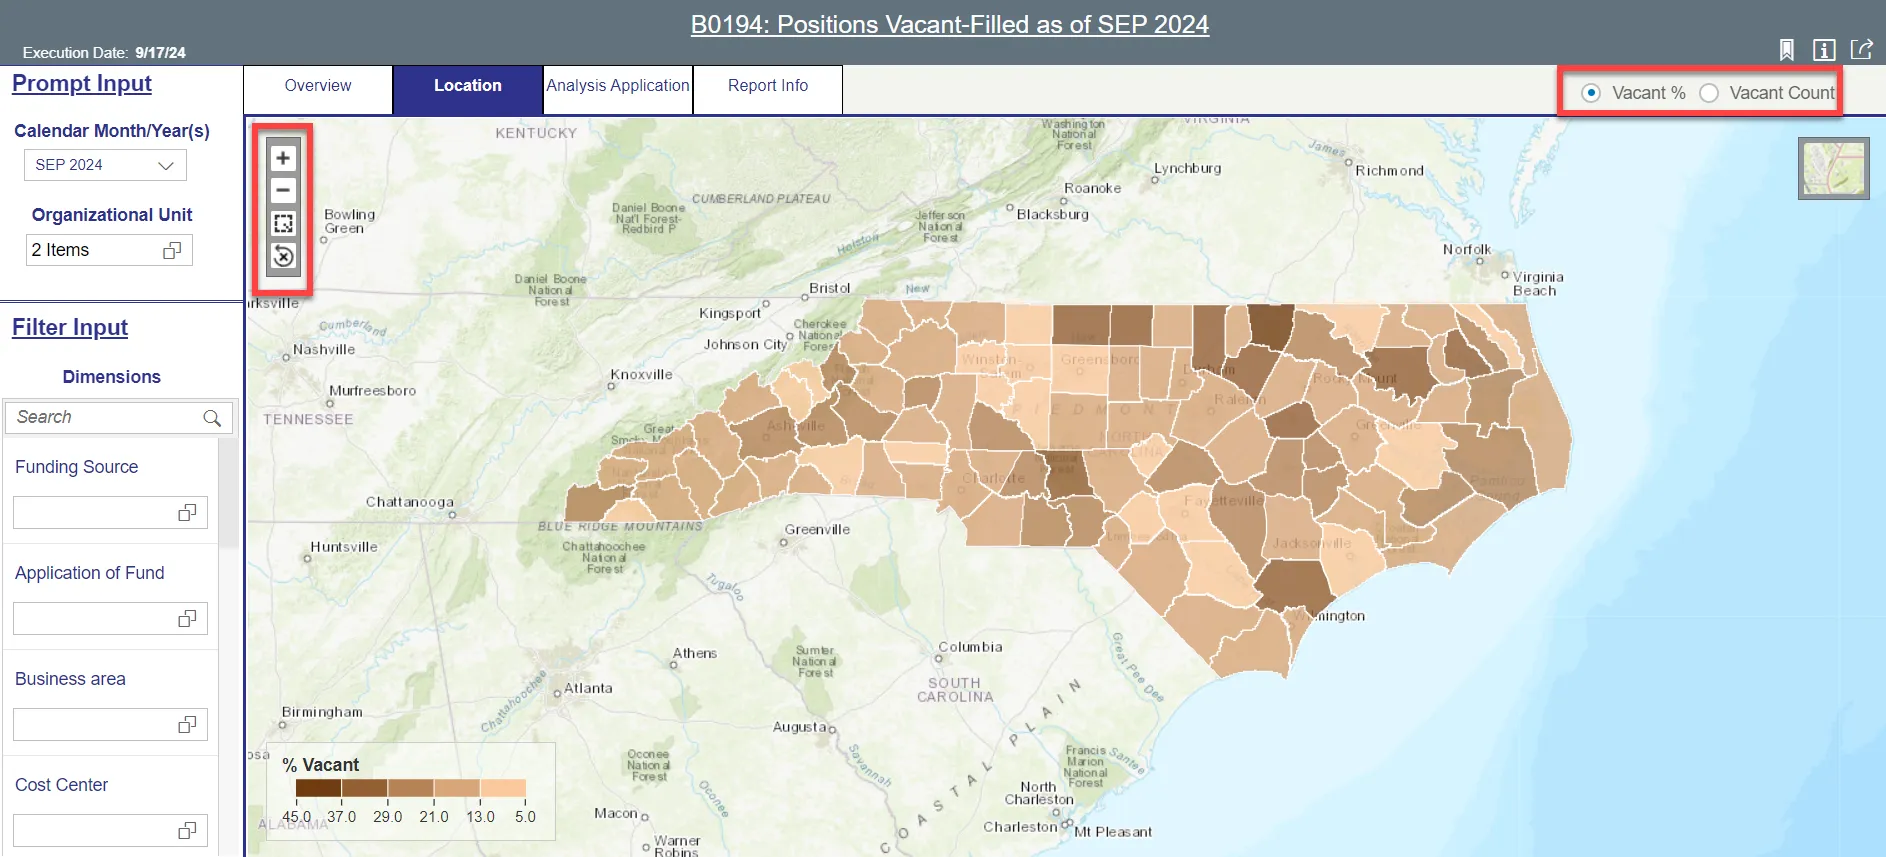
- The initial view defaults to rendering the map based on the Vacant % metric. There are radio buttons at the top to toggle the map view to render based on the Vacant Count metric.
- The upper left corner has the zoom controls.
Analysis Application Tab
The Analysis Application tab is an interactive interface to manipulate the data table on the workspace to customize this data view.
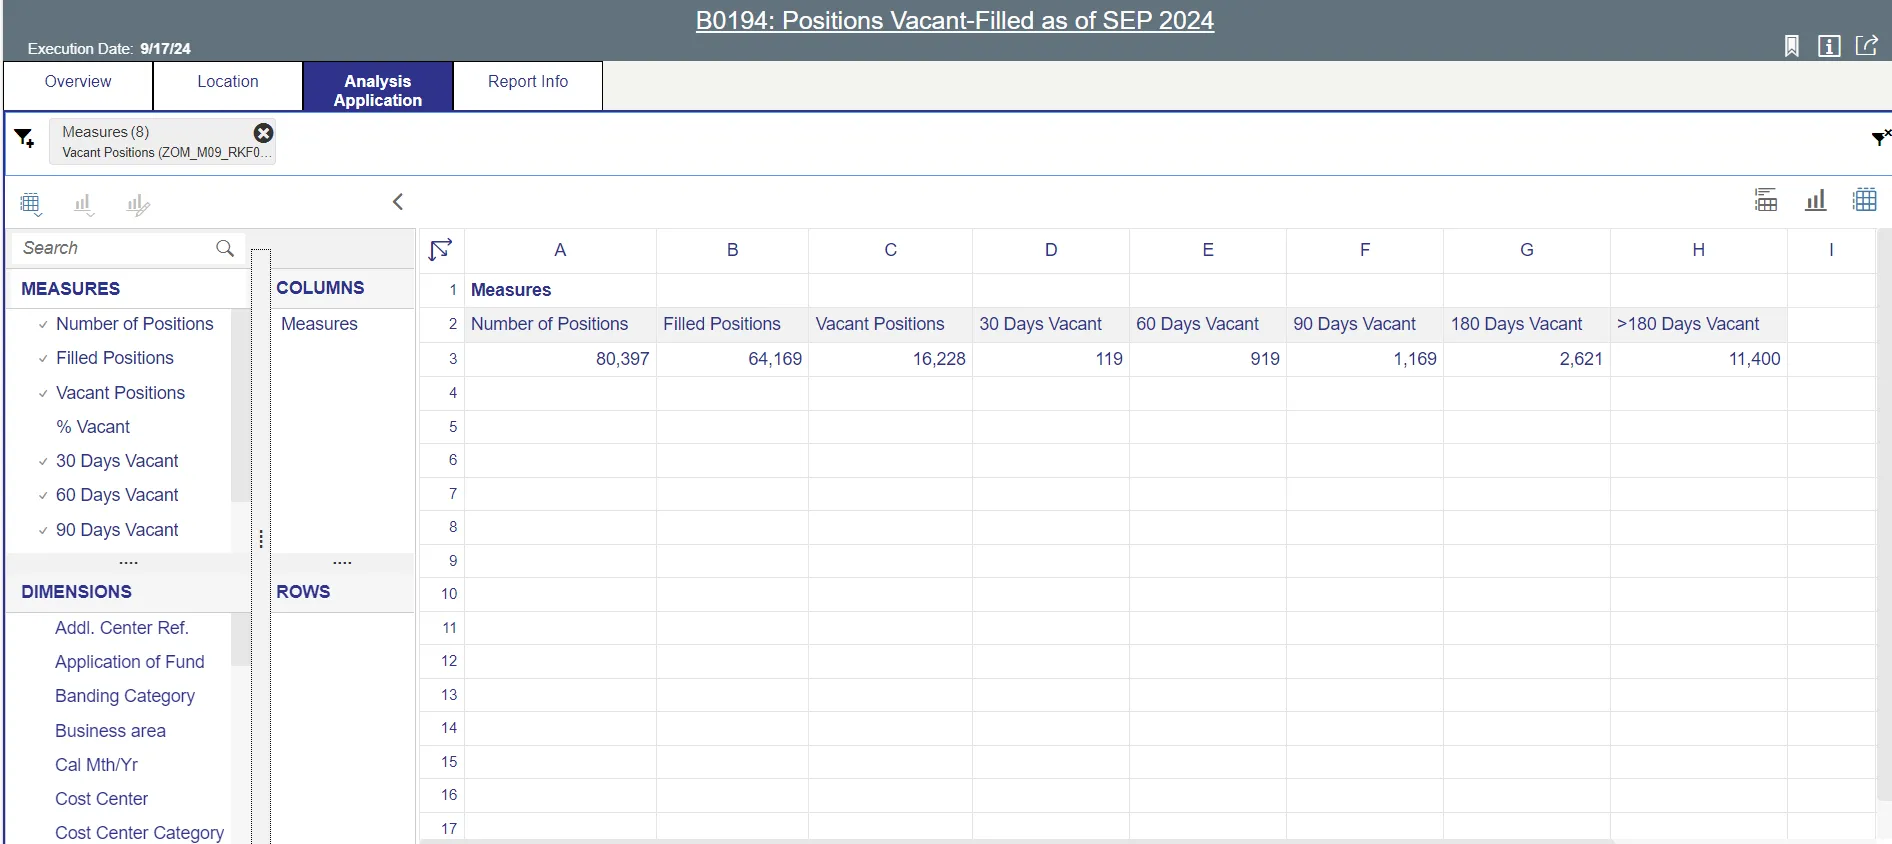
- Dimensions can be dragged into the ‘ROWS’ area to customize the data table.
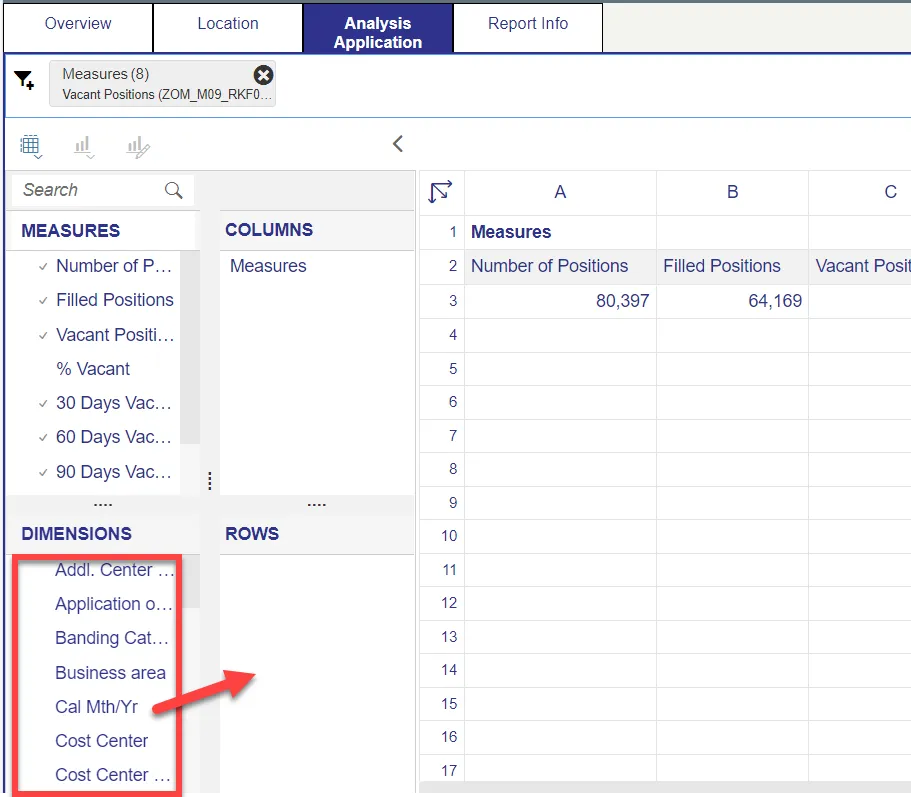
- The funnel icon can be used to apply additional dimension filters to the data set.
NOTE: Applying filters in this tab will affect the data on all other tabs also (Overview, Location).
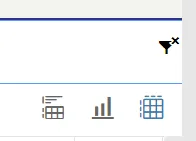
- Upper right corner has controls to enable switching your data view to a different type of chart or table.
Prompt Input Control
The Prompt Input control has two dimensions which are pre-filled with default values for the initial execution.
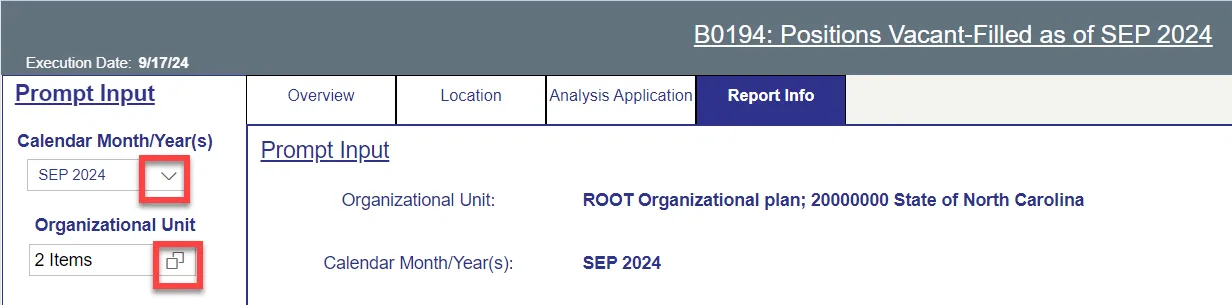
- Calendar Month/Year(s): The default value is set to current month. The value can be changed by using the dropdown arrow.
- Organizational Unit: The default value is the top-level Organizational Unit(s) to which the user has access. The value can be changed by clicking the icon at the end.
Note: Prompt Input values apply to data across all tabs (Overview, Location, Analysis Application).
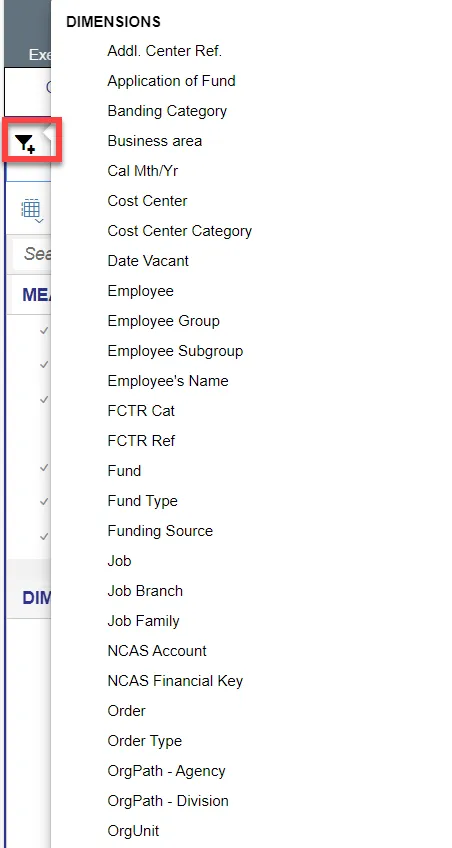
Filter Input Control
The Filter Input control contains many dimensions that may be used to further narrow down the data.
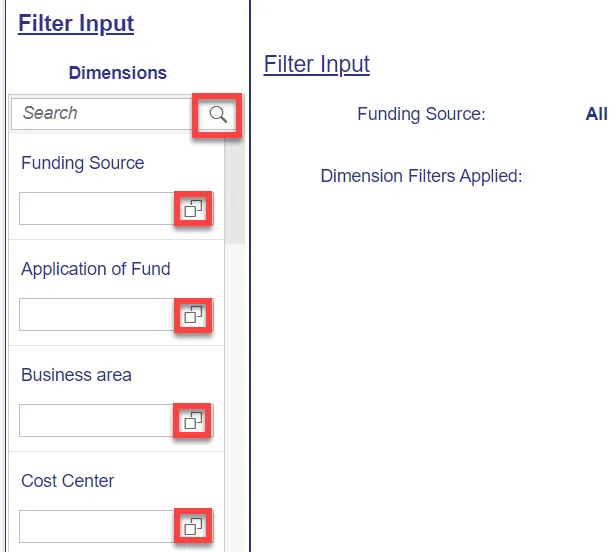
- The Search box allows you to search for specific dimension names.
- Use the icons at the end of each Dimension name to filter for specific values in each Dimension.
- Dimensions Available for Filter Input:
- Funding Source
- Application of Fund
- Business Area
- Cost Center
- Employee Group
- Employee Subgroup
- Fund
- Job
- Job Branch
- Job Family
- Order
- OrgPath - Agency
- OrgPath – Division
- Pos Personnel Area
- SAP GL Account
Note: Filter Input values apply to data across all tabs (Overview, Location, Analysis Application).
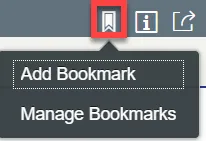
Additional Standard Controls
The upper right corner contains three standard controls available.
- A Bookmark can be set by using the first icon in the grouping.
- The Info icon displays the information about the dashboard.
- The Export icon allows exporting to various format.
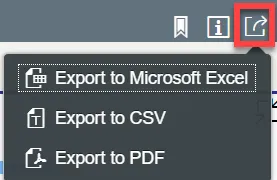
- Export to PDF will export images from all tabs as well as the full screen image of each chart.
Note: PDF export of heat map in Location tab is not available. The heat map image can be captured via screenshot if desired.
Special Report Considerations/Features
- Temporary employees are excluded from reporting.