Purpose
The purpose of this Report Description is to display Job Attributes within the Integrated HR Payroll System.
Report Description
The B0165 Job Attributes report displays detail about selected job(s), including job min/max/ref information, within organizational units. This report lists all jobs with or without any associated positions.
Report Location
OM: Job Attributes folder
Report Uses
- This report can be generated to view of list of job classifications within an organizational unit.
- The report can be used to compare the job classifications statewide to job classifications within a specific agency. In order to compare, the “B0165-1 Job Attributes without Org Unit” report would also need to be generated for the same job classification(s) to obtain statewide information. The results from these two reports would then need to be evaluated manually.
- This report enables OSHR to effectively review and analyze changes related to the compensation plan.
- This report can be used by agencies to better forecast budgets and allow for more fiscally responsible ways to plan salaries for positions and/or equity for employees in the job classifications listed.
How to Generate This Report
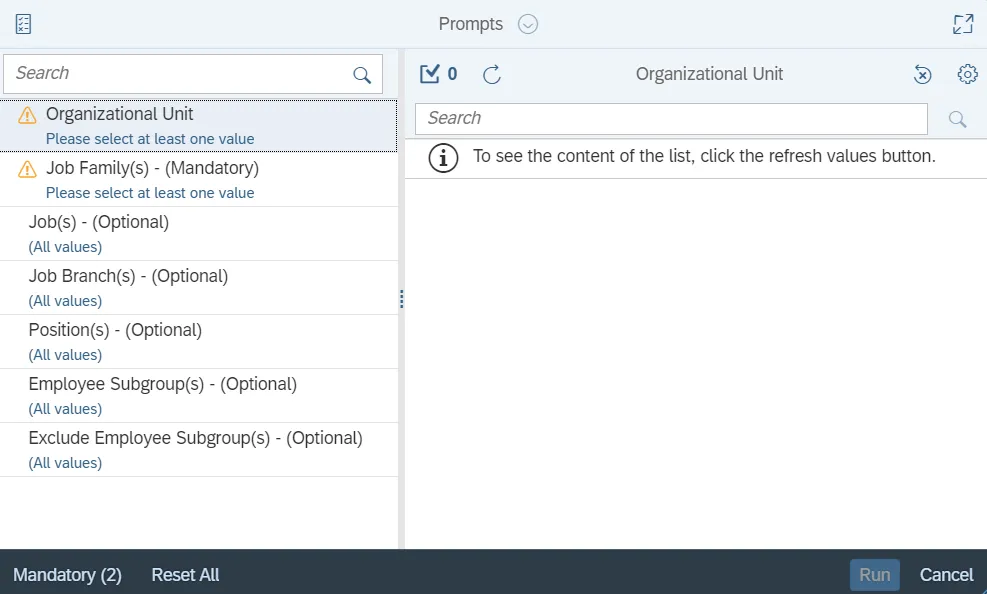
This report is generated after selecting values for the mandatory prompts. All mandatory prompts must have values selected before the Run Icon can be used to generate the report. Mandatory prompts can be identified as mandatory by the exclamation mark inside of the yellow-orange triangle, the square with the checkmark, or the display of (Mandatory). Detailed instructions for interaction with each prompt can be found on the Web Intelligence Prompt List on the OSC website.
The Mandatory prompts for this report are:
- Organizational Unit
- Job Family(s) - (Mandatory)
Note: This prompt will display only the Job Families relevant to the Org Unit selected earlier.
This report can also be further limited by utilizing the Optional prompts to further limiting the amount of data that retrieved into the body of the report. Optional prompts are indicated as optional in parentheses beside the prompt.
The Optional prompts are:
- Job(s) - (Optional)
- Job Branch(s) - (Optional)
- Position(s) - (Optional)
- Employee Subgroup(s) - (Optional)
Exclusion prompts exclude specified data by default while allowing customers the flexibility of changing them when necessary. Exclusion prompts are identified by the term Exclude followed by the prompt.
The Exclusion prompts are:
- Exclude Employee Subgroup(s) - (Optional)
Initial Layout
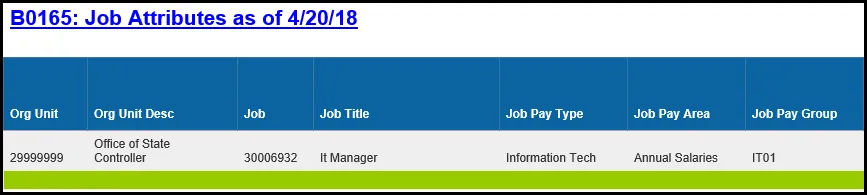
The report is generated with a list of jobs as of the current calendar month/year. This is a sample of the report.
Continued…
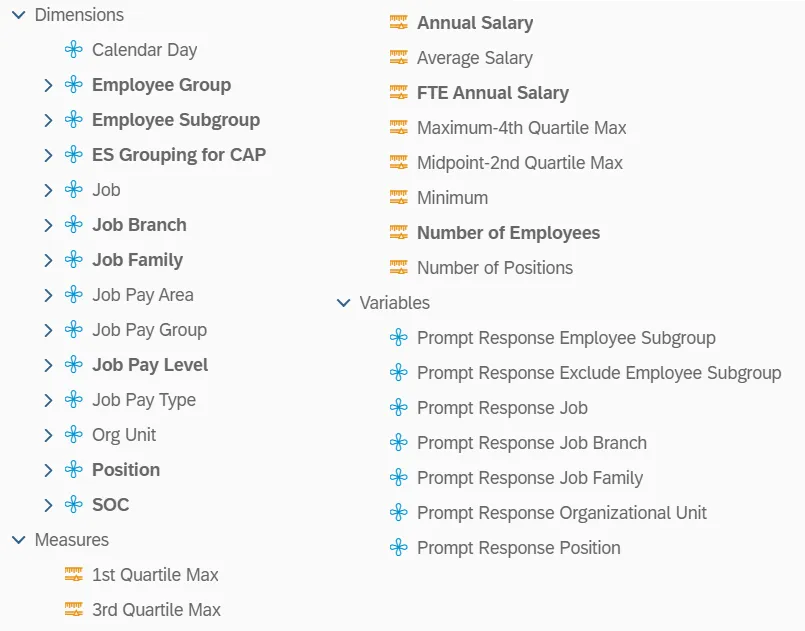
Available Objects
This is a list of the available objects that can be added to the report, from the Document Dictionary once in the Design mode:
Dimensions
- Calendar Day
- Employee Group
- Employe Subgroup
- ES Grouping for CAP
- Job
- Job Branch
- Job Family
- Job Pay Area
- Job Pay Group
- Job Pay Level
- Job Pay Type
- Org Unit
- Position
- SOC
Measures
- 1st Quartile Max
- 3rd Quartile max
- Annual Salary
- Average Salary
- FTE Annual Salary
- Maximum-4th Quartile Max
- Midpoint-2nd Quartile Max
- Minimum
- Number of Employees
- Number of Positions
Variables
- Prompt Response Employee Subgroup
- Prompt Response Exclude Employee Subgroup
- Prompt Response Job
- Prompt Response Job Branch
- Prompt Response Job Family
- Prompt Response Organizational Unit
- Prompt Response Position
Special Report Considerations/Features
- The report is generated with a list of jobs as of the current calendar month/year only. The data is refreshed daily and is current as of the close of business from the previous business day.
- Employee Subgroup G1 – Contractors are included in the report and can be excluded from the report either using the Exclude Employee Subgroup(s) - Optional prompt or through the report filter.
- Average Salary is calculated by dividing the FTE Annual Salary by the Number of Employees.
- Position and Job abbreviated titles (Short Text) are available from the Position or Job attributes (expanded list) in Available objects.
- Field/Home Based indicator is available from Position attributes (expanded list) in Available Objects.
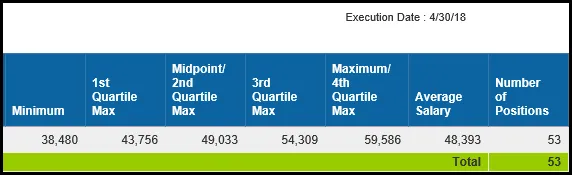
Example – How Quartiles are Populated
The following example describes how the quartiles on the report are populated from the salary tables.
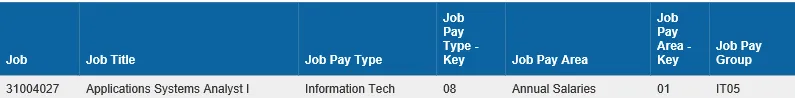
This is a sample row from the report where a job is defined with job pay group IT05, job pay area 01 (Annual Salaries), and Job Pay Type 08 (Information Tech):
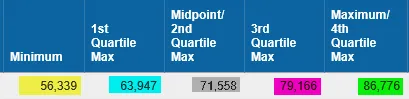
This is a selection from the salary table, with values for the Pay Levels for Pay Group IT05, Pay Area 01 and Pay Type 08:
| Pay Level | Minimum Salary | Maximum Salary | Job Reference Salary |
|---|---|---|---|
| 01 | 56,339 | 63,947 | 71,558 |
| 02 | 63,948 | 71,557 | 71,558 |
| 03 | 71,558 | 79,166 | 71,558 |
| 04 | 79,167 | 86,776 | 71,558 |
| IT | 56,339 | 86,776 | 71,558 |
The Minimum on the report is reflective of the Job Minimum Salary and is populated from the salary table’s Pay Level IT Minimum Salary (56,339).
The 1st Quartile Max on the report is populated from the salary table’s Pay Level 01 Maximum Salary (63,947).
The Midpoint/2nd Quartile Max on the report is populated from the salary table’s Pay Level IT Job Reference Salary (71,558).
The 3rd Quartile Max on the report is populated from the salary table’s Pay Level 03 Maximum Salary (79,166).
The Maximum/4th Quartile Max is reflective of the Job Maximum Salary and is populated from the salary table’s Pay Level IT Maximum Salary (86,776).
Pay Plans Defined
This is a list of pay plans defined for the State of NC. A brief description is included, along with whether quartiles apply to the pay plan. If quartiles do not apply, then the values for Quartile 1 Max and Quartile 3 Max will be equal to zeroes on the report.
| Pay Scale Type | Pay Scale Area | Description | Grade Range | Quartiles? |
|---|---|---|---|---|
| 01 | 01 | Graded Annual | GR50 thru GR96 | No |
| 01 | 11 | Graded Hourly | GR50 thru GR96 | No |
| 01 | 04 | Medical Annual | MG00 thru MG18 | No |
| 01 | 16 | Medical Hourly | MG00 thru MG18 | No |
| 01 | 50 | Ports Annual | Port12 thru Port42 | No |
| 01 | 51 | Ports Hourly | Port12 thru Port42 | No |
| 01 | 60 | Investment Div Annual (Department of State Treasurer) |
ID GR10 thru ID GR25 | No |
| 01 | 09 | Judicial Graded Annual | JB10 thru JB30 | No |
| 01 | 18 | Judicial Graded Hourly | JB10 thru JB30 | No |
| 02 | 06 | Career Banded Annual | CB | No |
| 02 | 07 | Skill-Based Pay (Department of Transportation) |
SB | No |
| 02 | 20 | Career Banded Hourly | CB | No |
| 02 | 05 | Pilot Banding Annual (SBP) | PB | No |
| 02 | 19 | Pilot Banding Hourly (SBP) | PB | No |
| 03 | 14 | Flat Rate Annual | FR | No |
| 03 | 09 | Flat Rate Judicial Annual | JF, JM | No |
| 03 | 18 | Flat Rate Judicial Hourly | JF, JM | No |
| 03 | 13 | Flat Rate Univ. Faculty Annual | UF | No |
| 03 | 25 | Flat Rate Univ. Faculty Hourly | UF | No |
| 03 | 45 | Flat Rate GA Annual | GA | No |
| 04 | 01 | T-Grade Annual | TG50 thru TG96 | No |
| 04 | 11 | T-Grade Hourly | TG50 thru TG96 | No |
| 05 | 15 | X-Grade Annual | XG69 thru XG81 | No |
| 05 | 23 | X-Grade Hourly | XG69 thru XG81 | No |
| 06 | 01 | Executive Annual | EX01 thru EX06 | Yes |
| 06 | 11 | Executive Hourly | EX01 thru EX06 | Yes |
| 07 | 01 | General Annual | GN01 thru GN25 | Yes |
| 07 | 11 | General Hourly | GN01 thru GN25 | Yes |
| 08 | 01 | Information Tech. Annual | IT01 thru IT14 | Yes |
| 08 | 11 | Information Tech. Hourly | IT01 thru IT14 | Yes |
| 09 | 01 | Attorney Annual | AT01 thru AT12 | Yes |
| 09 | 11 | Attorney Hourly | AT01 thru AT12 | Yes |
| 10 | 01 | Education Annual | ED20 thru ED27 | Yes |
| 10 | 11 | Education Hourly | ED20 thru ED27 | Yes |
| 11 | 01 | Medical Annual | MG00 thru MG18 | Yes |
| 11 | 11 | Medical Hourly | MG00 thru MG18 | Yes |
| 12 | 01 | State Hwy Patrol Annual | HP00 thru HP11 | Yes |
| 12 | 11 | State Hwy Patrol Hourly | HP00 thru HP11 | Yes |
| 13 | 01 | Supplemental Retirement Plan Board (Department of State Treasurer) |
SR10 thru SR25 | No |
| 14 | 11 | Temporary Solutions (hourly only) | TS01 thru TS37 | No |
| 15 | 01 | Investment Division | ID10 - ID25 | No |