Purpose
The purpose of this report description is to explain how to generate the General Turnover Metric report.
Report Description
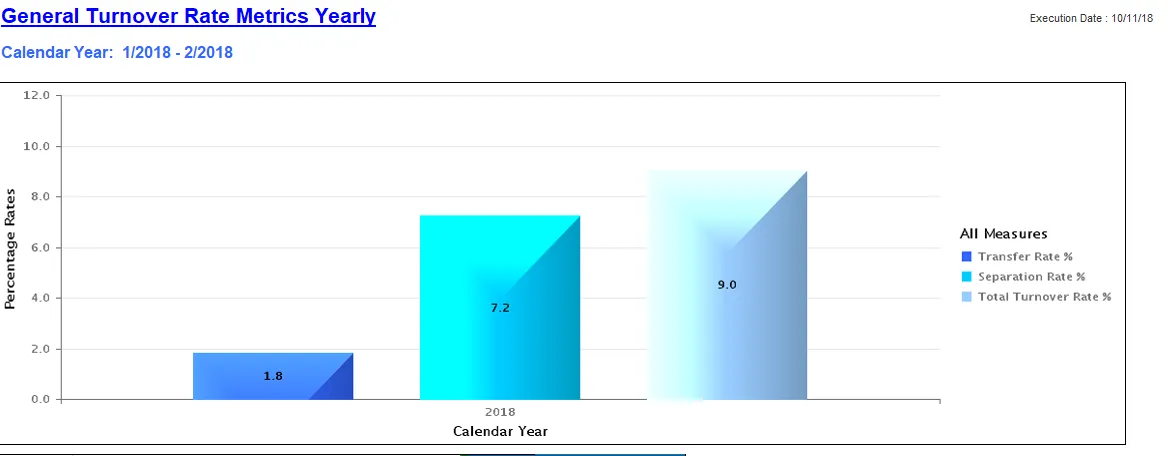
This report identifies the turnover percentage rate and separation percentage rate by agency. The report contains the following rate calculations:
- Transfer Rate %
- Separation Rate %
- Total Turnover Rate % (the previous 2 combined)
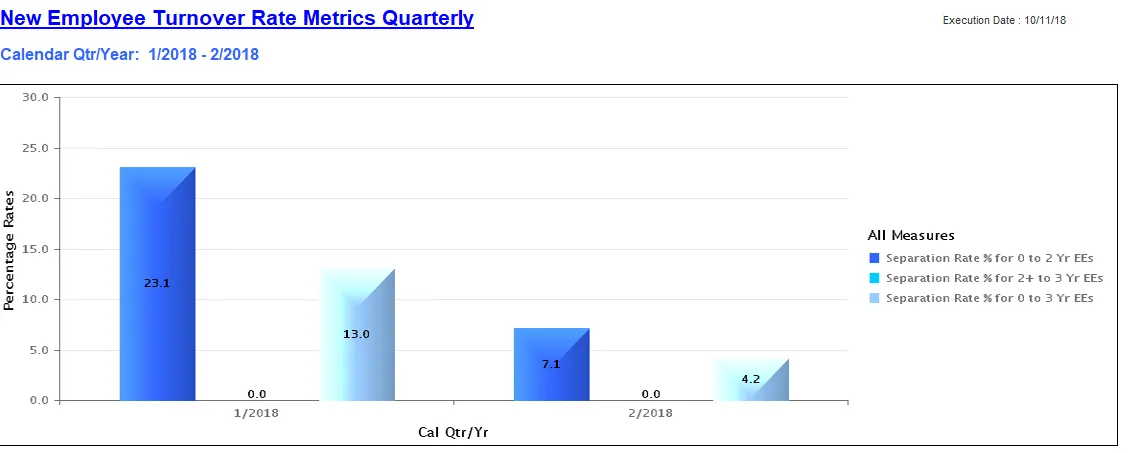
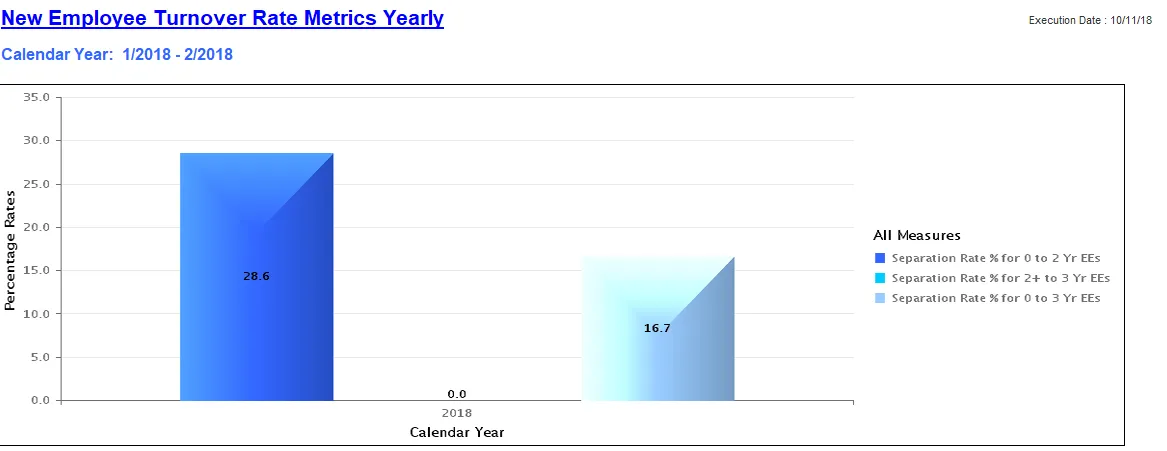
- Separation Rate % for 0 to 2 Yr EEs
- Separation Rate % for 2+ to 3 Yr EEs
- Separation Rate % for 0 to 3 Yr EEs (previous 2 combined)
Report Location
Agency Performance Metrics
Report Uses
This report is useful in identifying high turnover rates which can negatively impact the operational efficiency of an agency and can result in increased costs for recruitment and training.
Turnover information in this report can be used to help agencies develop more targeted retention efforts and conduct more effective succession planning.
Information on new employee turnover in this report can help the state agencies identify more targeted retention efforts or determine if broader solutions are needed to ensure the state remains competitive with the private sector for attracting new talent.
How to Generate This Report
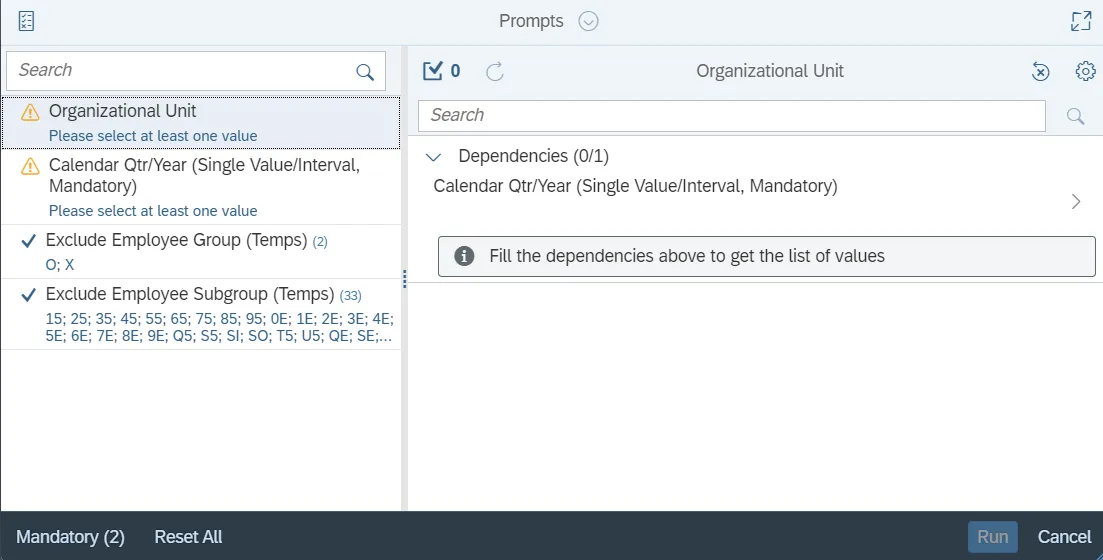
This report is generated after selecting values for the mandatory prompts. All mandatory prompts must have values selected before the Run Icon can be used to generate the report. Mandatory prompts can be identified as mandatory by the exclamation mark inside of the yellow-orange triangle, the square with the checkmark, or the display of (Mandatory). Detailed instructions for interaction with each prompt can be found on the Web Intelligence Prompt List on the OSC website.
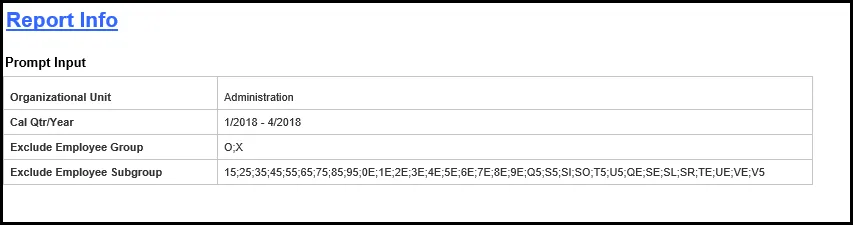
The Mandatory prompts for this report are:
- Organizational Unit
- Calendar Qtr/Year (Single Value/Interval, Mandatory)
Exclusion prompts exclude specified data by default while allowing customers the flexibility of changing them when necessary. Exclusion prompts are identified by the term Exclude followed by the prompt.
The Exclusion prompts are:
- Exclude Employee Group (Temps)
- Exclude Employee Subgroup (Temps)
Initial Layout
This report contains four report tabs.
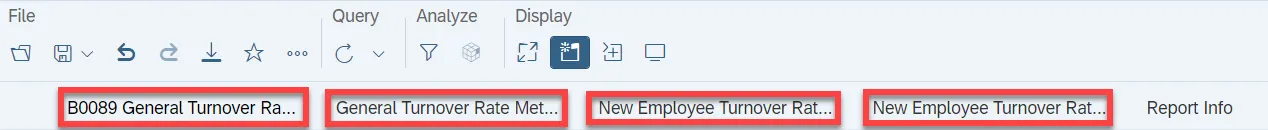
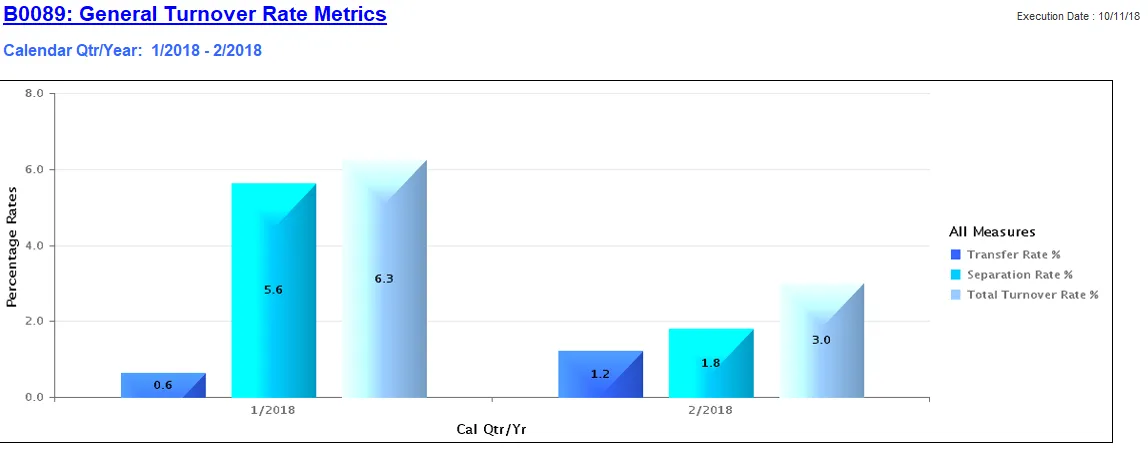
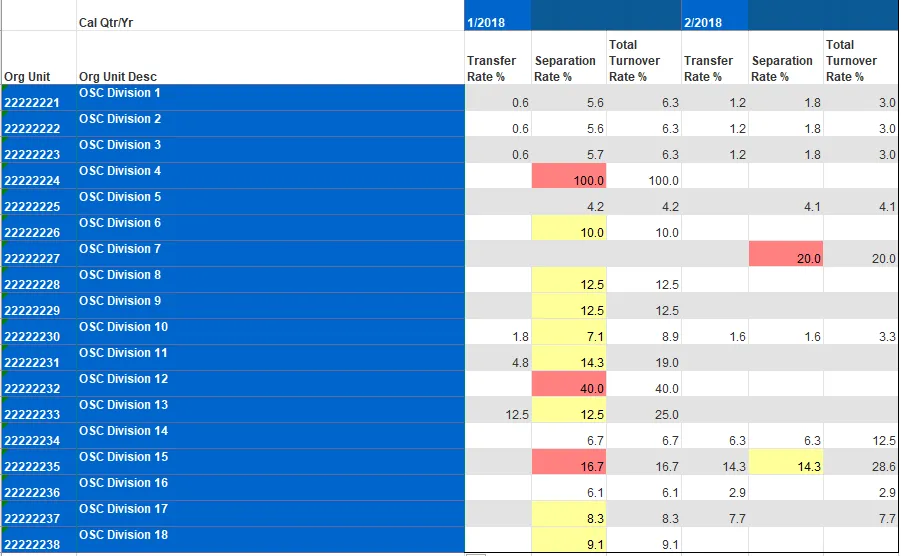
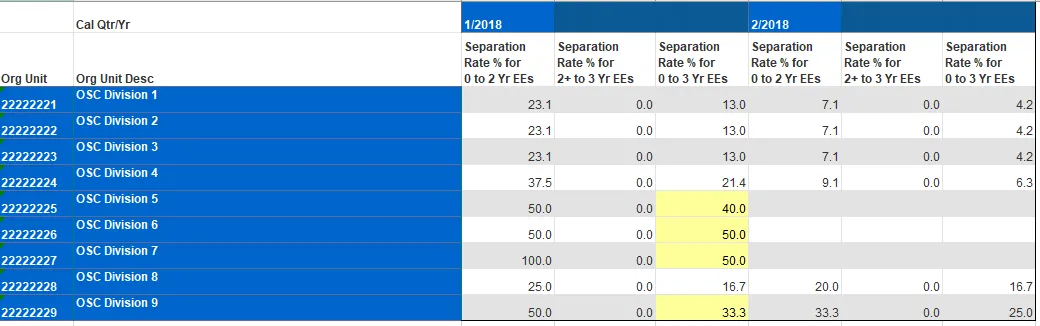
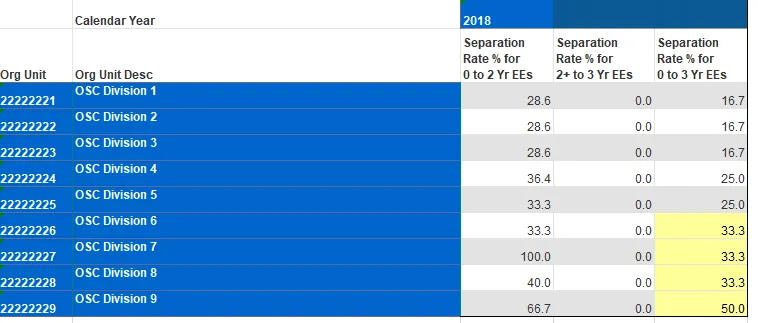
Each report tab contains a bar chart, and a detailed crosstab report. These are sample renderings of the reports:
- B0089 General Turnover Rate Metrics Quarterly tab
- General Turnover Rate Metrics Yearly tab
- New Employee Turnover Rate Metrics Quarterly tab
- New Employee Turnover Rate Metrics Yearly tab
- Report Info tab displays information about the prompts entered
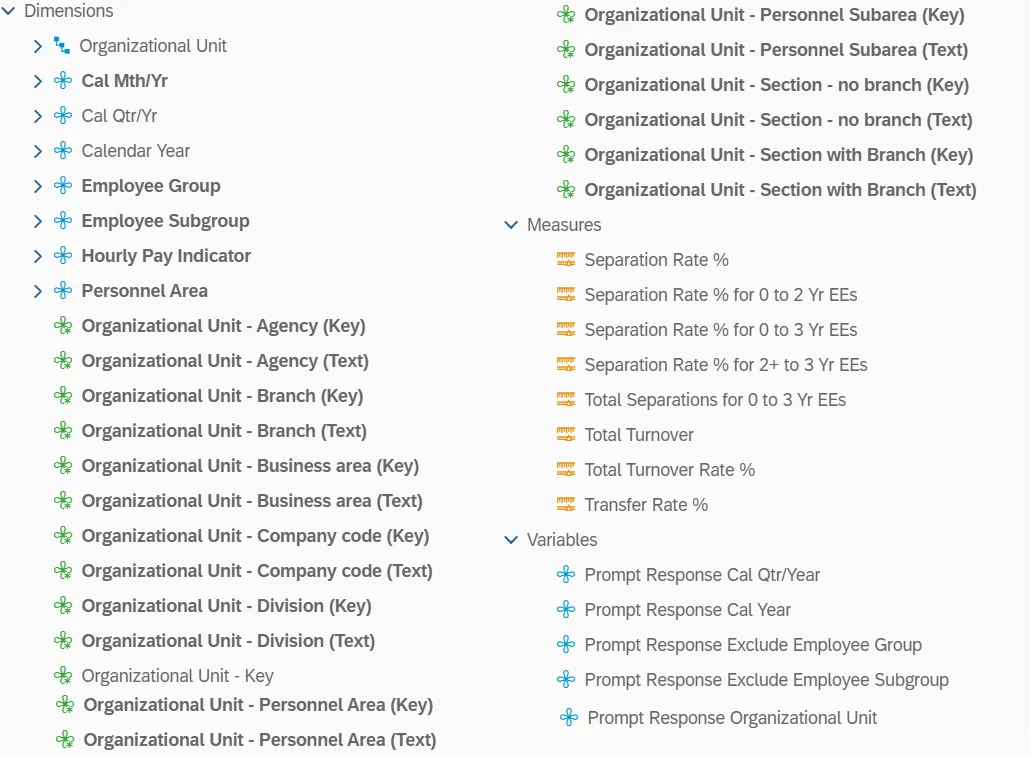
Available Objects
This is a list of the available objects that can be added to the report, from the Document Dictionary once in the Design mode:
Dimensions
- Organizational Unit
- Cal Mth/Yr
- Cal Qtr/Yr
- Calendar Year
- Employee Group
- Employee Subgroup
- Hourly Pay Indicator
- Personnel Area
- Organizational Unit – Agency (Key)
- Organizational Unit – Agency (Text)
- Organizational Unit – Branch (Key)
- Organizational Unit – Branch (Text)
- Organizational Unit – Business area (Key)
- Organizational Unit – Business area (Text)
- Organizational Unit – Company code (Key)
- Organizational Unit – Company code (Text)
- Organizational Unit – Division (Key)
- Organizational Unit – Division (Text)
- Organizational Unit – Key
- Organizational Unit – Personnel Area (Key)
- Organizational Unit – Personnel Area (Text)
- Organizational Unit – Personnel Subarea (Key)
- Organizational Unit – Personnel Subarea (Text)
- Organizational Unit – Section – no branch (Key)
- Organizational Unit – Section – no branch (Text)
- Organizational Unit – Section – with Branch (Key)
- Organizational Unit – Section – with Branch (Text)
Measures
- Separation Rate %
- Separation Rate % for 0 to 2 Yr EEs
- Separation Rate % for 0 to 3 Yr EEs
- Separation Rate % for 2+ to 3 Yr EEs
- Total Separations for 0 to 3 Yr EEs
- Total Turnover
- Total Turnover Rate %
- Transfer Rate %
Variables
- Prompt Response Cal Qtr/Year
- Prompt Response Exclude Employee Group
- Prompt Response Exclude Employee Subgroup
- Prompt Response Organizational Unit
Special Report Considerations/Features
- There is a known issue with the Calendar Qtr/Year prompt. If you refresh values for Calendar Qtr/Year and select start and end values from the list of values, you will get an error. The report will not run. Work around this issue by entering the dates directly as described in the instructions above.
- This report excludes hourly employees.
- This report excludes supplemental employees in the following list:
- Employee Groups:
- O – Supplemental Staff
- X – Supplemental Staff Grant
- Employee Subgroups:
- 0E;15;1E;25;2E;35;3E;45;4E;55;5E;65;6E;75;7E;85;8E;95;9E;Q5;QE;S5;SE;SI; SL;SO:SR;T5;TE;U5;UE;V5;VE
- Employee Groups:
| 0E PT S-FLSAOT Temp MAG 15 FT N-FLSAOT Temp Dir 1E PT N-FLSAOT Temp Dir 25 FT N-FLSAOT Temp JB1 2E PT N-FLSAOT Temp JB1 35 FT N-FLSAOT Temp JB2 3E PT N-FLSAOT Temp JB2 45 FT N-FLSAOT Temp JB3 4E PT N-FLSAOT Temp JB3 55 FT N-FLSAOT Temp DA 5E PT N-FLSAOT Temp DA 65 FT N-FLSAOT Temp ADA 6E PT N-FLSAOT Temp ADA 75 FT N-FLSAOT Temp MAG 7E PT N-FLSAOT Temp MAG 85 FT S-FLSAOT Temp CR 8E PT S-FLSAOT Temp CR 95 FT N-FLSAOT Temp CSC 9E PT N-FLSAOT Temp CSC Q5 FT N-FLSAOT Temp SC QE PT N-FLSAOT Temp SC S5 FT N-FLSAOT Temp CJP SE PT N-FLSAOT Temp CJP SI FT N-FLSAOT Temp ACJP SL PT N-FLSAOT Temp ACJP SO FT S-FLSAOT Temp ACJP SR PT S-FLSAOT Temp ACJP T5 FT N-FLSAOT Temp AD TE PT N-FLSAOT Temp AD U5 FT N-FLSAOT Temp JBS UE PT N-FLSAOT Temp JBS V5 FT S-FLSAOT Temp JBS VE PT S-FLSAOT Temp JBS |
- This report excludes actions reasons: Cancel Separation Pay Continuation and Did Not Report.
- Scorecard colors are applied only to the Separation Rate % column using the following criteria:
- <=7%: No color (Implied Green)
- 7.1 - 15%: Yellow
- >15%: Red
- 0 to 3 Yr EE Separations <=25% No color (Implied Green)
- 0 - 3 Yr EE Separations 25.1 - 50%: Yellow
- 0 to 3 Yr EE Separations >50%: Red