Purpose
The purpose of this report is to display employee compensation data by quartile for employees and new hires in the Integrated HR-Payroll System.
Report Description
This dashboard displays compensation analysis metrics for employees and new hires.
Report Location
PA: Compensation
Report Uses
- Analyze employee salary quartile distribution by different factors such as education level, related education and experience, job family and salary to determine compensation trends.
- Analyze new hires salary quartile distribution to ensure compensation trends for new hires align with the compensation philosophy of the State/Agency.
How to Generate This Report
There are no prompts required to generate this dashboard. Click on the report name “B0056: Compensation Analysis by Quartile” in the PA: Compensation folder, and the report will execute.
The dashboard is generated with data contained in multiple tabs. The initial rendering defaults to showing data specific to the agency OrgUnits for which the user has access.
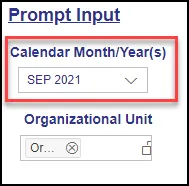
Prompt Input Control
The Prompt Input control has two dimensions which are pre-filled with default values for the initial execution.
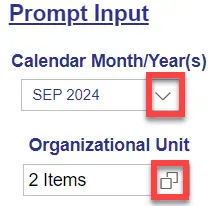
- Calendar Month/Year(s): The default value is set to current month. The value can be changed by using the dropdown arrow.
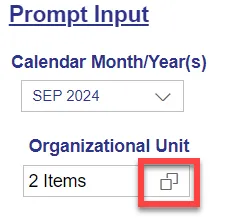
- Organizational Unit: The default value is the top-level Organizational Unit(s) to which the user has access. The value can be changed by clicking the icon at the end.
Note: Prompt Input values will always apply to data across all tabs (Overview, New Hires and Analysis tabs).
Filter Input Control
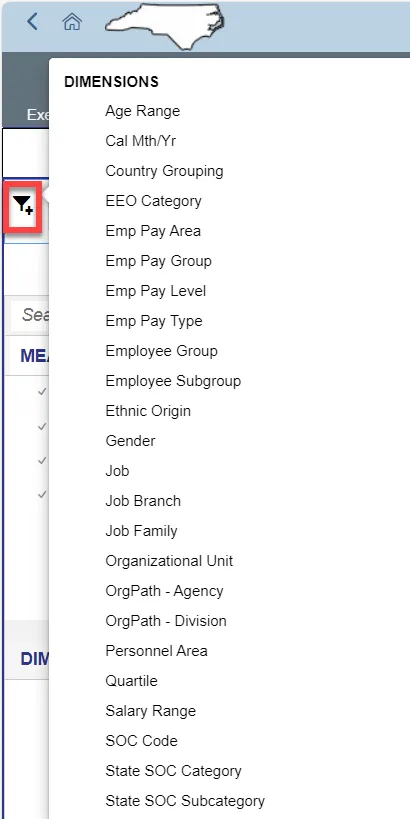
The Filter Input control contains many dimensions that can be used to further narrow down the data.
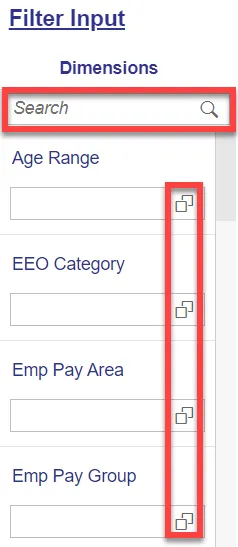
- The Search box allows you to search for specific dimension names.
- Use the icons at the end of each Dimension name to filter specific values in each Dimension.
- Dimensions Available for Filter Input:
- Age Range
- EEO Category
- Emp Pay Area
- Emp Pay Group
- Emp Pay Level
- Emp Pay Type
- Employee Group
- Employee Subgroup
- Ethnic Origin
- Gender
- Job
- Job Branch
- Job Family
- OrgPath – Agency
- OrgPath – Division
- Personnel Area
- SOC Code
- State SOC Subcategory
Note: Filter Input values apply to data across all tabs (Overview, New Hires) except Analysis Application. Analysis Application Tab functions independently in this dashboard.
Overview Tab
Below is a sample of the dashboard charts under the Overview tab:
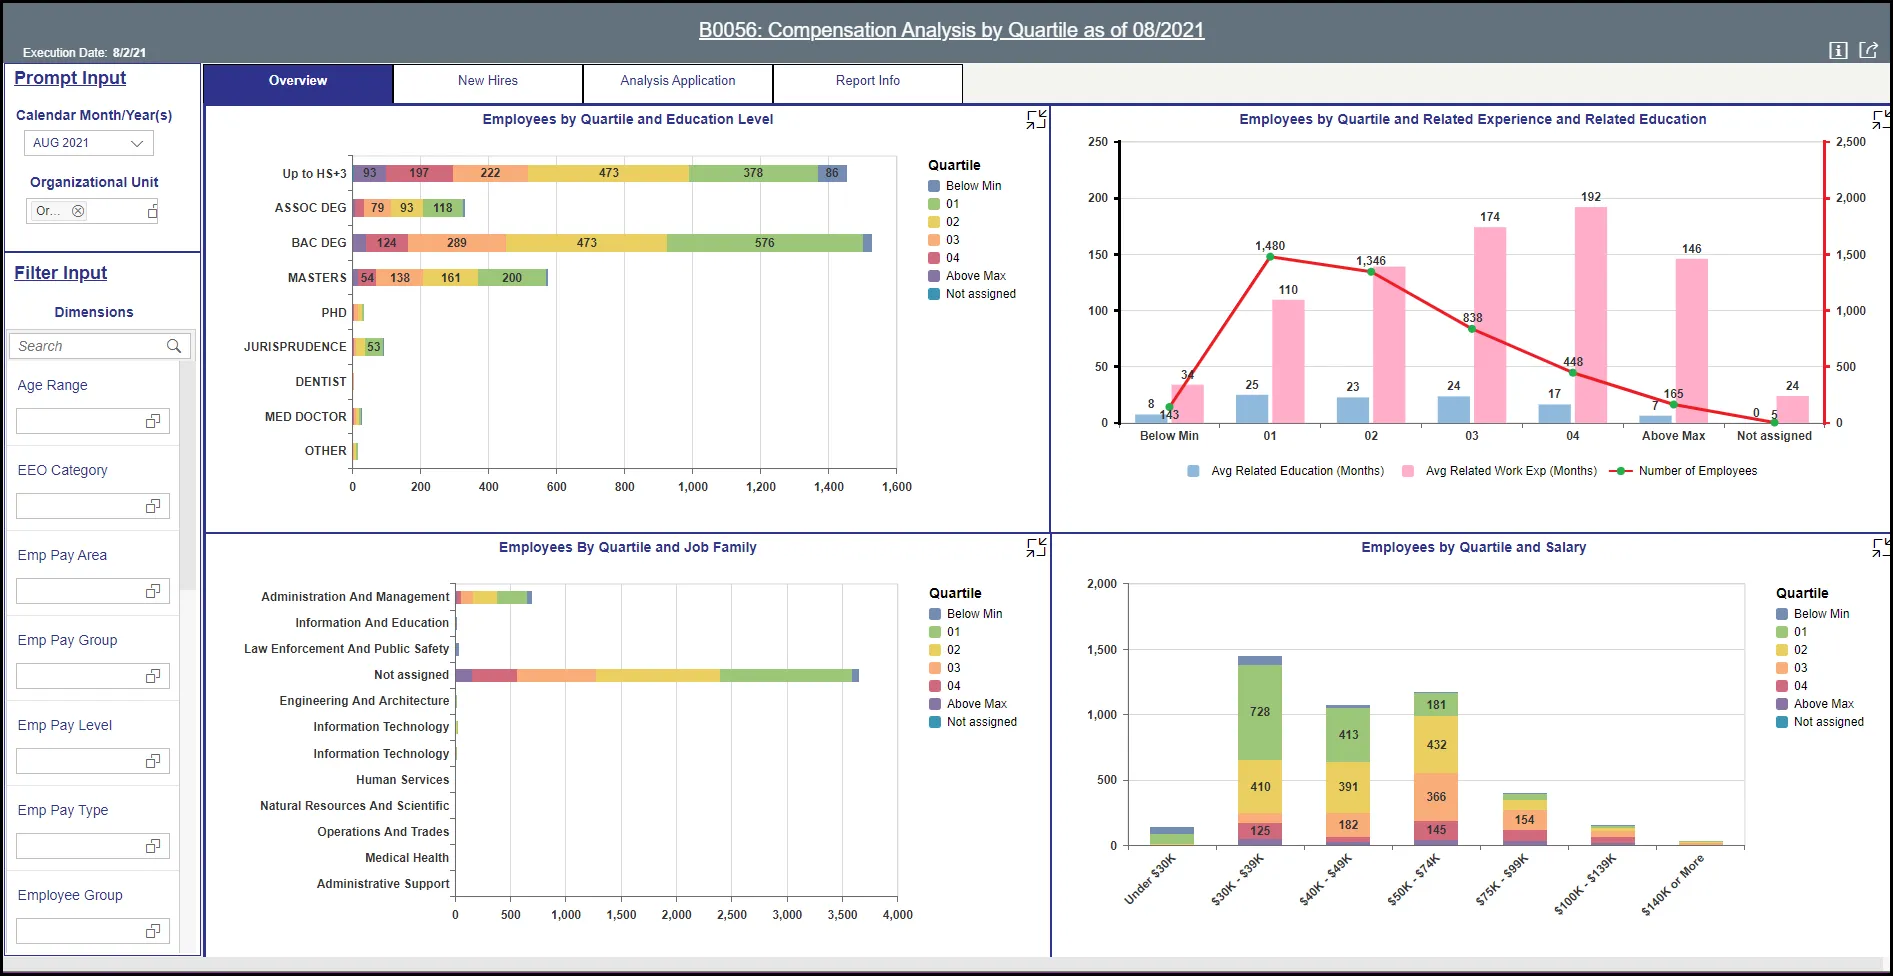
There are four data components displayed in this tab.
- Bar chart showing Employees by Quartile and Education Level.
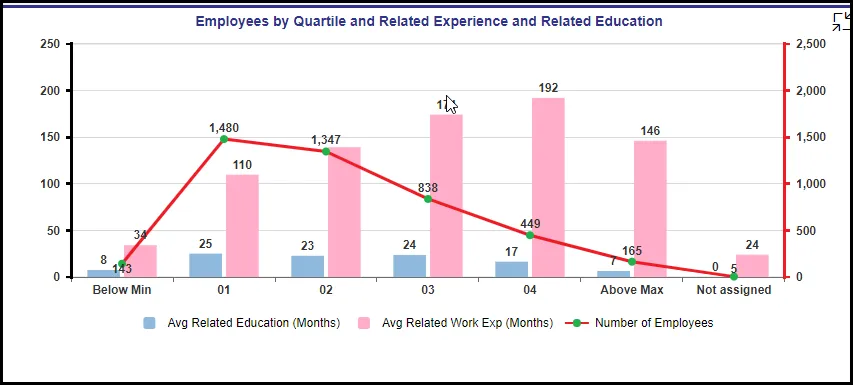
- Combination Chart showing Employees by Quartile and Related Experience and Related Education.
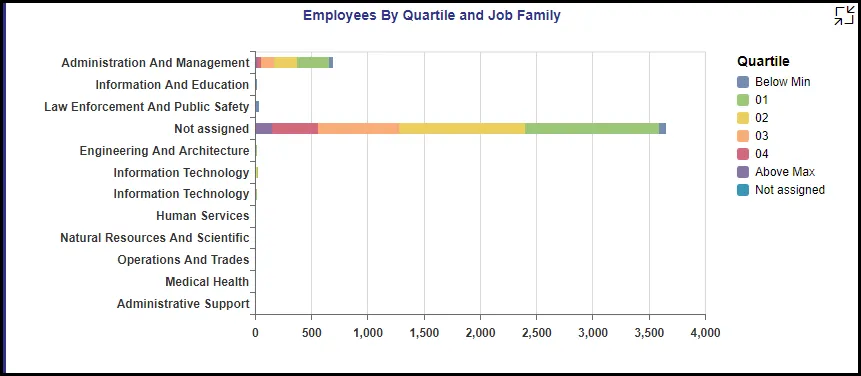
- Bar chart showing Employees by Quartile and Job Family.
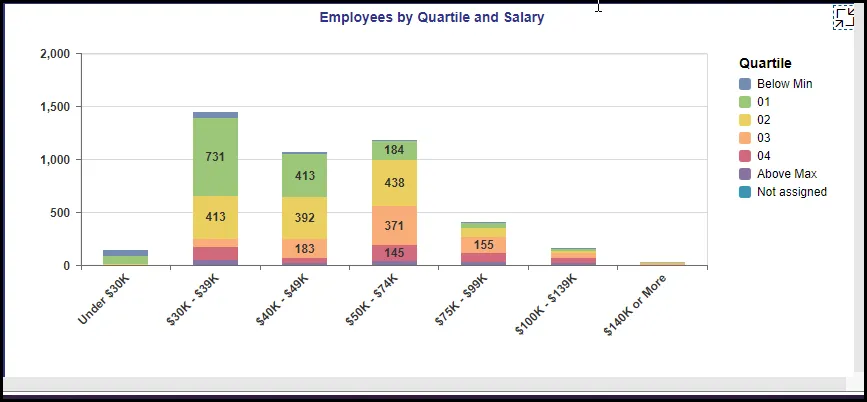
- Column Chart showing Employees by Quartile and Salary
Many charts contain an icon in the upper right corner to enable expansion of the chart to full-screen view.
Note:
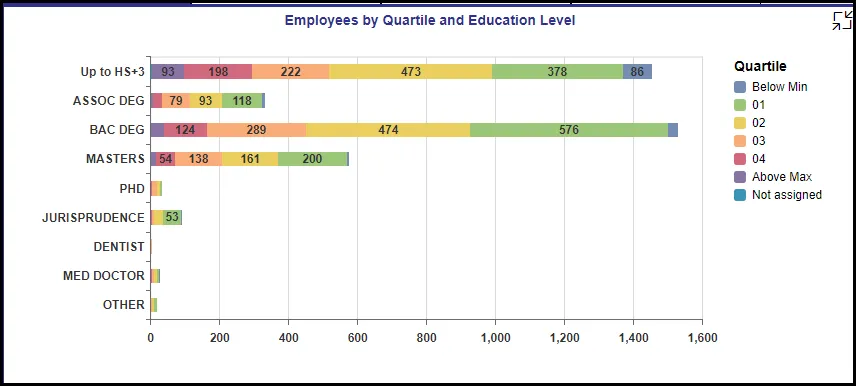
- Detailed view icon on ‘Employees by Quartile and Education Level’ chart will show a full screen view of a bar chart showing Employees by Quartile and Education Level, this is the exact same view of the original chart just enlarged.
- Detailed view icon on ‘Employees by Quartile and Related Experience and Related Education’ chart will show a split screen view of the data.
- Chart one shows a combination chart of a column and line chart that is an exact replica of the front view just enlarged.
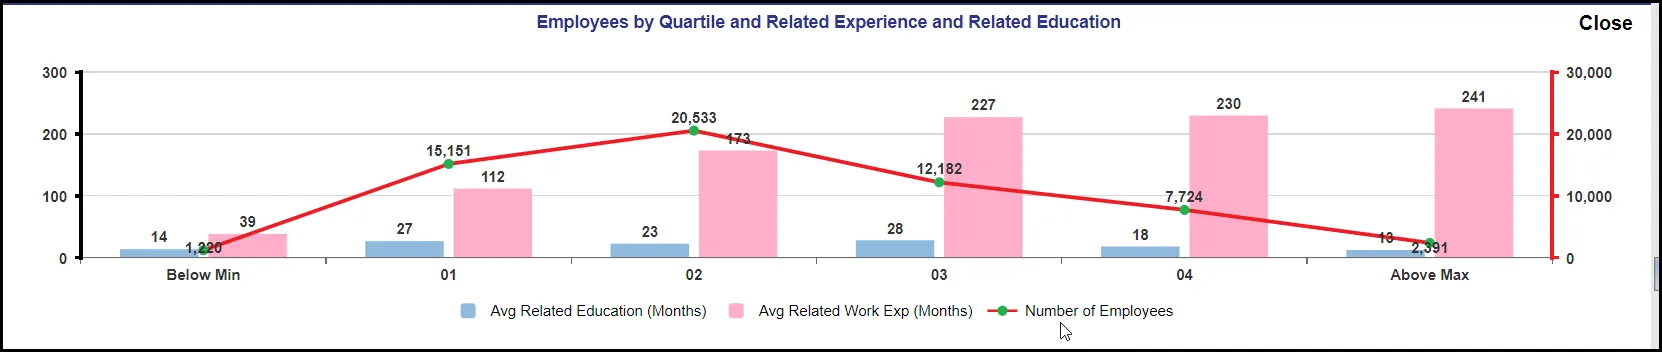
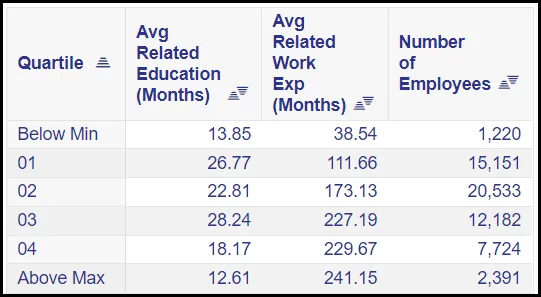
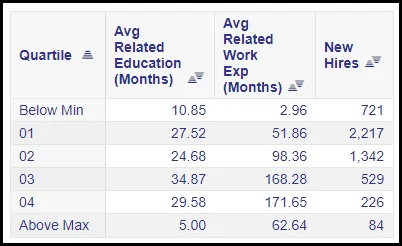
- Chart two is a crosstab that shows the data of Quartile, Average Related Education (Months), Average Related Work Experience (Months) and Number of Employees.
- Detailed view icon on ‘Employees by Job Family’ chart will show a full screen view of the original view from the main page of a bar chart showing Employees by Quartile and Job Level.
- Detailed view icon on ‘Employees by Quartile and Salary’ chart will show a full screen view of the original chart on the main page displaying a column chart showing the Employees by Quartile and Salary.
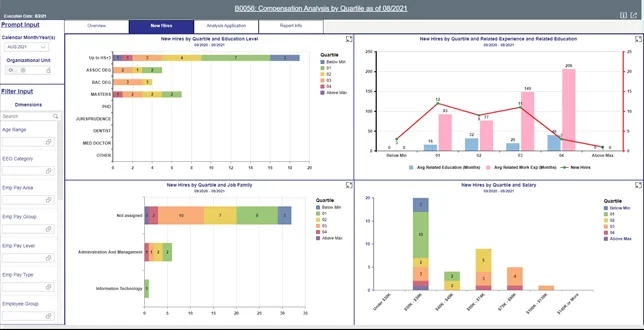
New Hires Tab
Below is a sample of the dashboard charts under the New Hires tab:
All data for New Hires is based on a 12-month period ending with the selected month shown in the prompt input Calendar/Month Year(s) drop-down.
There are four data components displayed in this tab.
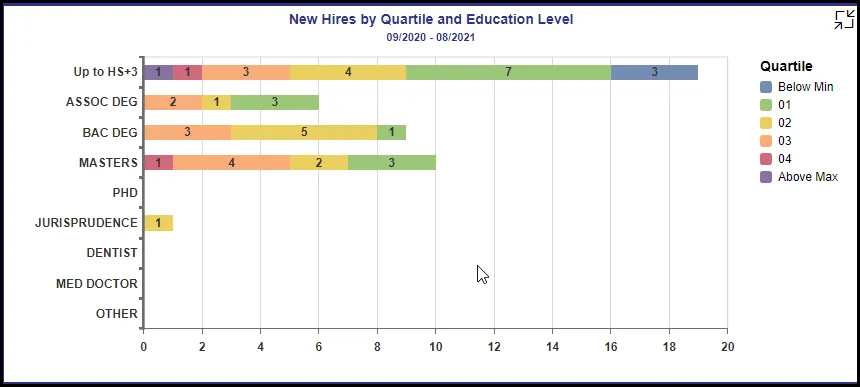
- A bar chart component showing New Hires by Quartile and Education Level.
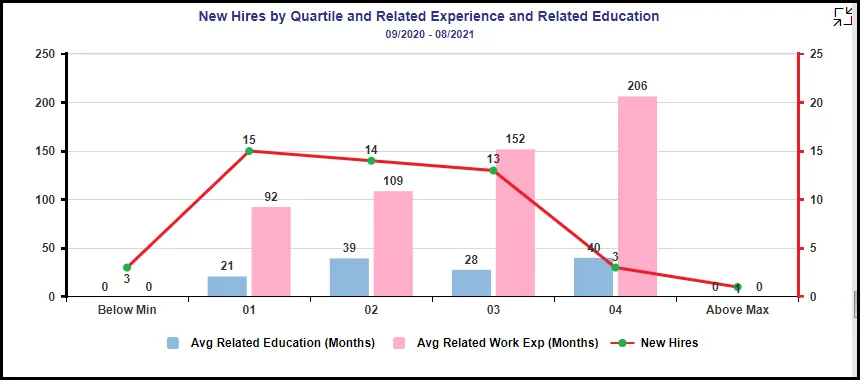
- A combination Chart showing New Hires by Quartile and Related Experience and Related Education.
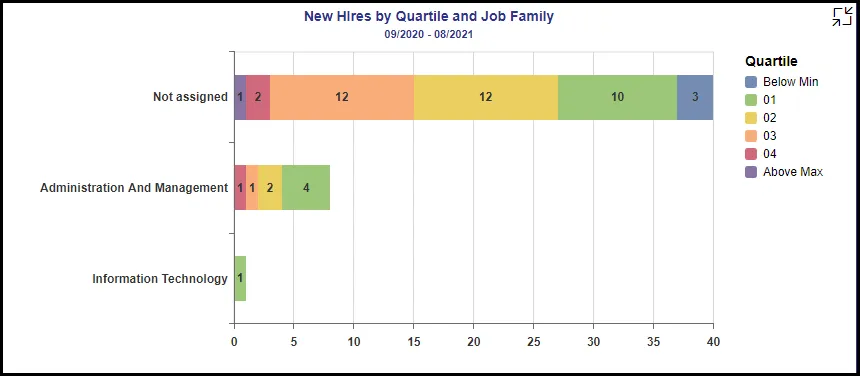
- A Bar Chart showing New Hires by Quartile and Job Family.
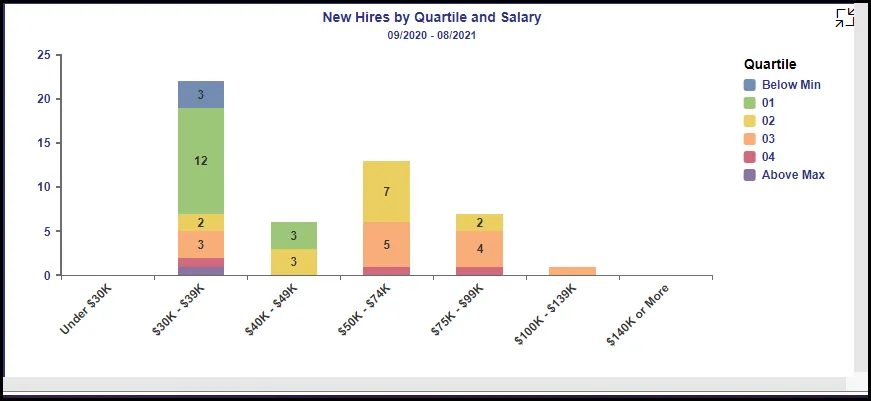
- A Column Chart showing New Hires by Quartile and Salary.
Note:
- Detailed view icon on ‘New Hires by Quartile and Education Level’ chart will show a full screen view of a bar chart showing New Hires by Quartile and Education Level, this is the exact same view of the original chart just enlarged.
- Detailed view icon on ‘New Hires by Quartile and Related Experience and Related Education’ chart will show a split screen view of the data.
- Chart one shows a combination column and line chart that is an exact replica of the front view just enlarged.
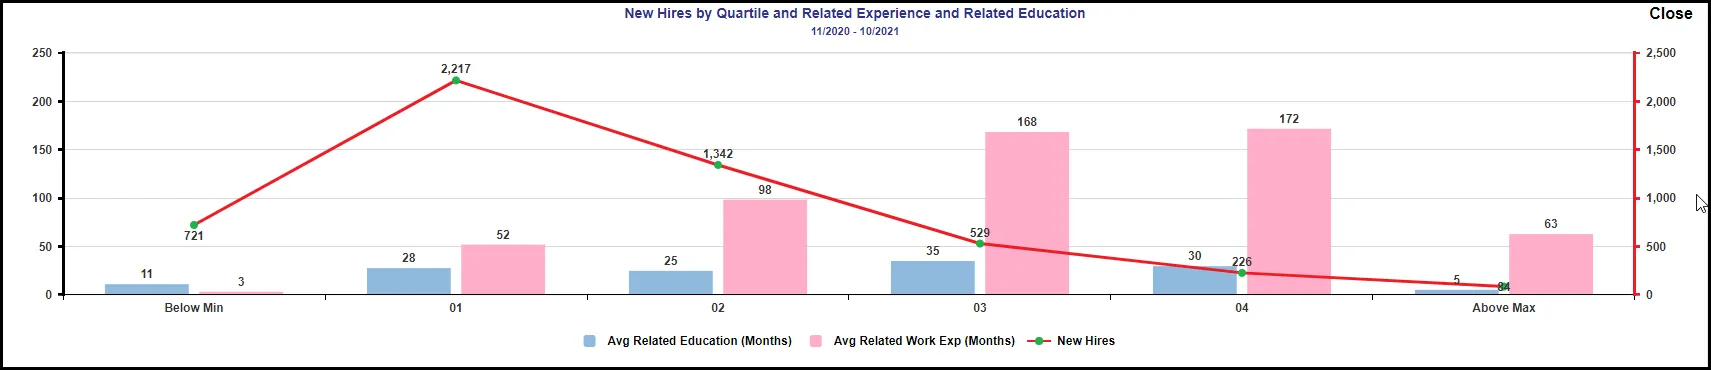
- Chart two is a crosstab that shows the data of Quartile, Average Related Education (Months), Average Related Work Experience (Months) and Number of New Hires.
- Detailed view icon on ‘New Hires by Job Family’ chart will show a full screen view of the original view from the main page of a bar chart showing New Hires by Quartile and Job Level.
- Detailed view icon on ‘New Hires by Quartile and Salary’ chart will show a full screen view of the original chart on the main page displaying a column chart showing the New Hires by Quartile and Salary.
Analysis Application Tab
The Analysis Application tab is an interactive interface to manipulate the data table on the workspace to customize this data view.
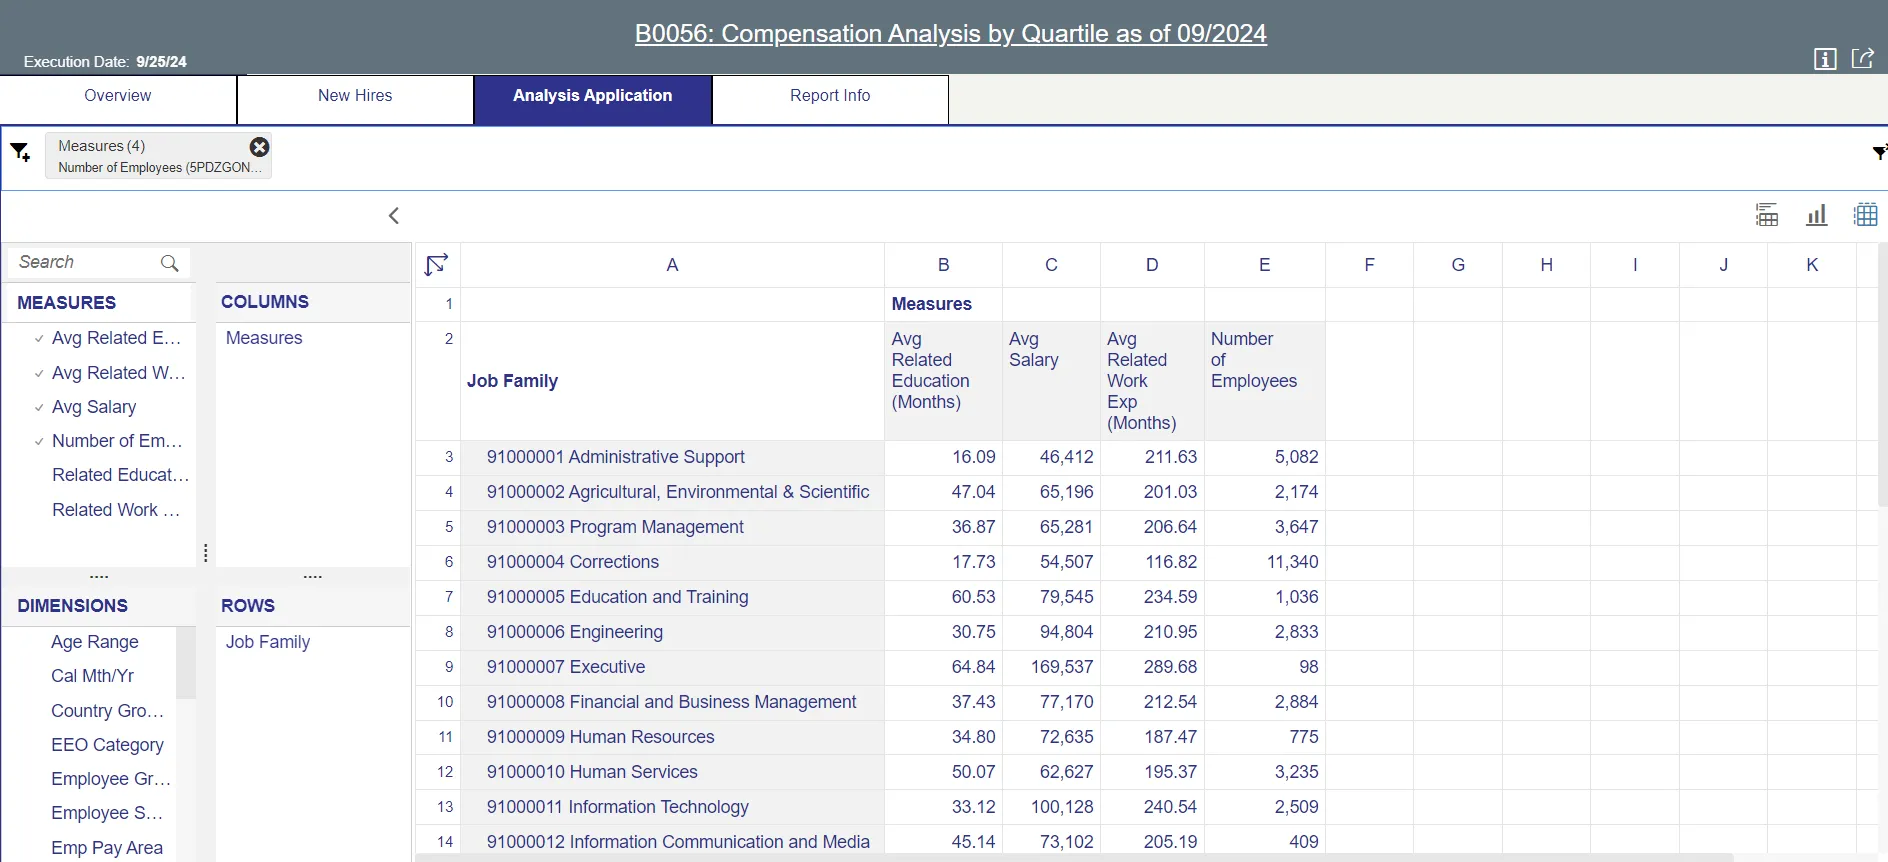
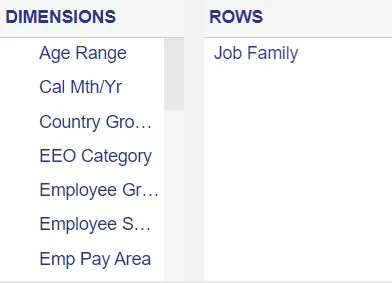
- Dimensions can be dragged into the ‘ROWS’ area to customize the data table.
- The funnel icon can be used to apply additional dimension filters to the data set.
Note: Applying filters in this tab will NOT affect the data on all other tabs (Overview, New Hires).
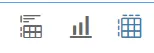
- Upper right corner has controls to enable switching your data view to a different type of chart or table.
Additional Standard Controls
The upper right corner contains two standard controls available.

- The Info icon displays information about the dashboard.

- The Export icon allows exporting to various formats.
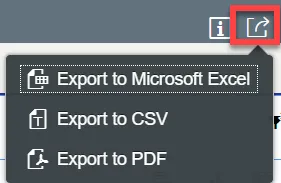
- Export to PDF will export images from the current active tab.
Special Report Considerations/Features
- Temporary employees are excluded.
- Only employees assigned to Quartile pay structures are represented in this dashboard.
- Employee Pay Types Included in this dashboard:
- 06 Executive
- 07 General
- 08 Information Tech
- 09 Attorney
- 10 Education
- 11 Medical
- 12 State Hwy Patrol
- 16 Correctional Officer
- 17 Probation Parole Officer
- 18 – North Carolina (NC)
- 19 – Digital Technology (DT)
- 20 – Legal (LG)
- 21 – Medical and Health (MH)
- 22 – Sworn (SW)
- Labels Defined:
- Below Min: Quartile 00
- Above Max: Quartile ZZ
The following are employee actions selected for counting New Hires:
| Action Type | Action Reason |
|---|---|
| Z0 - New Hire (NC) | 01 - New Hire |
| Z2 - Reinstatement/Reemployment(NC) | 02 - Rtn St w/in 12 mths-Higher S/G |
| Z2 - Reinstatement/Reemployment(NC) | 04 - Return to State within 5 years |
| Z2 - Reinstatement/Reemployment(NC) | 05 - Return to State after 5 years |
| Z2 - Reinstatement/Reemployment(NC) | 39 - Temp to Perm |
| Z7 - Non-Beacon to Beacon(NC) | 04 - Rtn St w/in 12 mths-Same S/G |
| Z7 - Non-Beacon to Beacon(NC) | 05 - Rtn St w/in 12 mths-Higher S/G |
| Z7 - Non-Beacon to Beacon(NC) | 06 - Rtn St w/in 12 mths-Lower S/G |
| Z7 - Non-Beacon to Beacon(NC) | 07 - Return to State within 5 years |
| Z7 - Non-Beacon to Beacon(NC) | 08 - Return to State after 5 years |
- How to see ‘Key and Text’ in Prompt Input and Filter Input panels. There are 3 steps to complete this process.
Step 1: Choose Organizational Unit from Prompt Input panel.
Step 2: Choose the Settings icon at the far right.
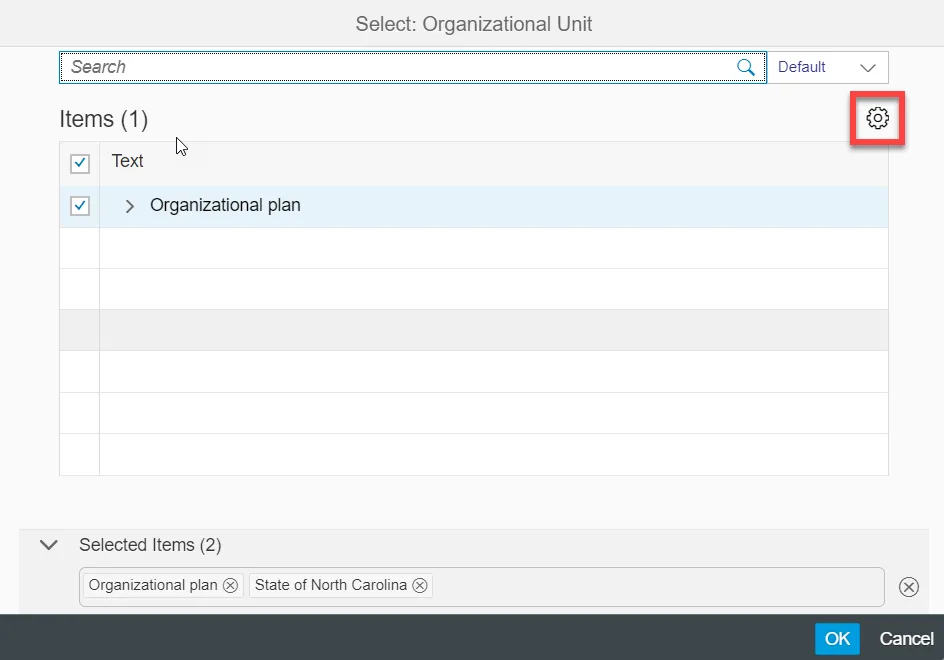
Step 3: Choose Key and Text.
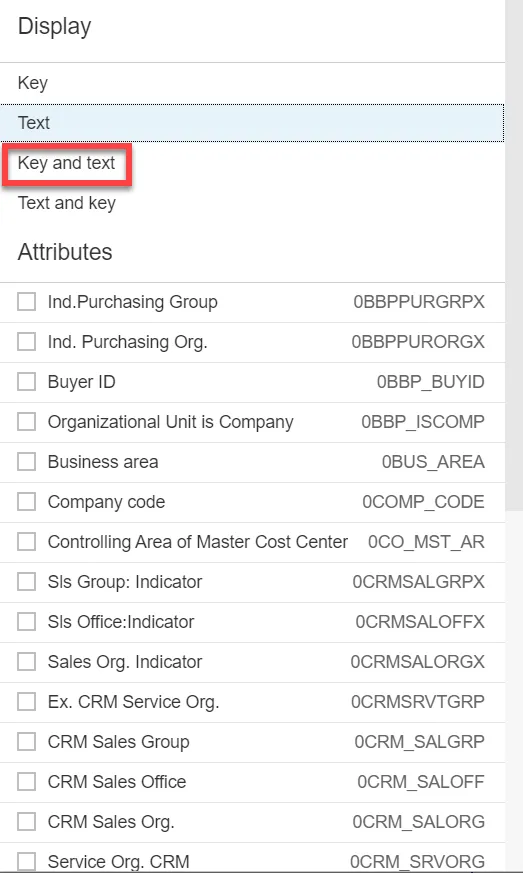
Note: Key and Text can be selected the same way in Filter Input panel dimensions too.