Purpose
The purpose of this report is to describe and explain how to generate the Retirement Eligibility Analysis dashboard in the Integrated HR-Payroll System.
Report Description
This dashboard shows the number of full-time active employees that meet the criteria to be eligible for unreduced retirement benefits at a future time as specified by the user. The dashboard includes projected eligibility by static year breakouts (Eligible Now, Eligible in 1, 2, 3 and 5 years), by Salary Range, by Job Family, by Gender, by Ethnicity, and by Age Range.
Report Location
PA: Longevity & Retirement
Report Uses
- Determine where losses are expected for recruitment.
- Analyze which job classifications may be harder to recruit and retain.
- Succession planning at a high level, e.g. executive, division.
How to Generate This Report
There are no prompts required to generate this dashboard. Click on the report name “B0055: Retirement Eligibility Analysis” in the PA: Longevity & Retirement folder, and the report will execute.
The dashboard is generated with data contained in multiple tabs. The initial rendering defaults to showing data specific to the agency OrgUnits for which the user has access.
Prompt Input Control
The Prompt Input control has two dimensions which are pre-filled with default values for the initial execution.
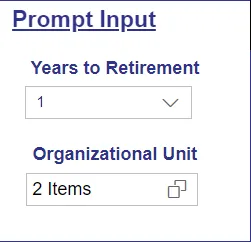
- Years to Retirement: The default value is set to 1 year. The value can be changed by using the dropdown arrow
- Organizational Unit: The default value is the top-level Organizational Unit(s) to which the user has access. The value can be changed by clicking the icon at the end
Note: Prompt Input values apply to data across all tabs (Overview, Demographics, Location, Analysis Application).
Filter Input Control
The Filter Input control contains many dimensions that can be used to further narrow down the data.
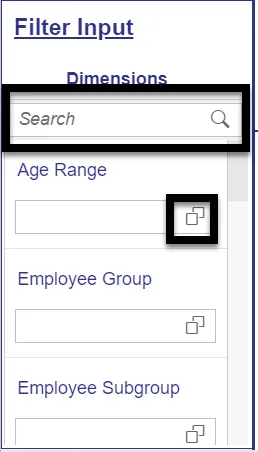
- The Search box allows you to search for specific dimension names.
- Use the icons at the end of each Dimension name to filter for specific values in each Dimension.
- Dimensions Available for Filter Input:
- Age Range
- Employee Group
- Employee Subgroup
- Employee Type
Note: This is a custom dimension to simplify filtering for LEO vs Non-LEO employees. - Ethnic Origin
- Gender
- Job
- Job Branch
- Job Family
- OrgPath - Agency
- OrgPath – Division
- Personnel Area
- Pos County
- Salary Range
Note: Filter Input values apply to data across all tabs (Overview, Demographics, Location, Analysis Application).
Overview Tab
Below is a sample of the dashboard charts under the Overview tab:
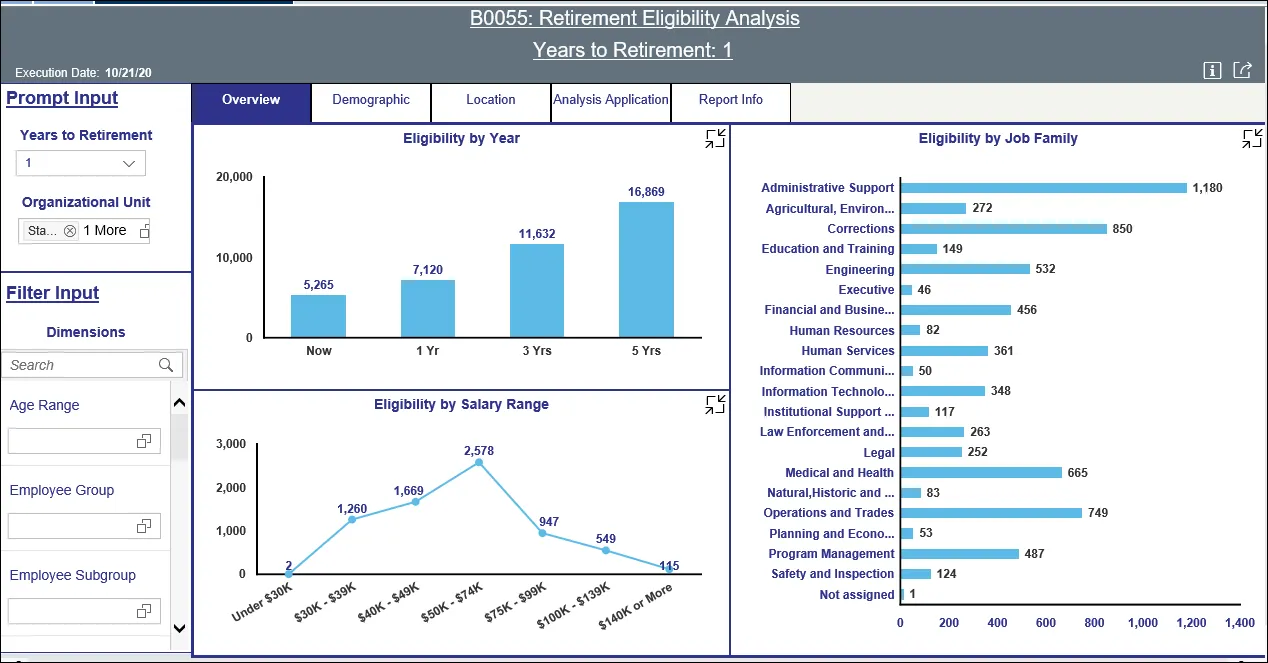
There are three data components displayed in this tab.
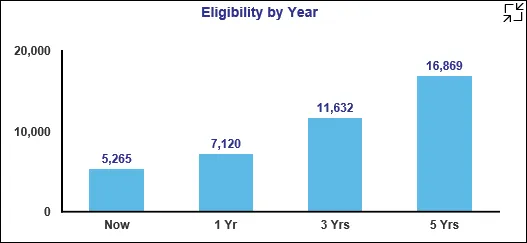
- Vertical Bar Chart showing Eligibility counts by Year. The metrics in this chart are independent of the ‘Years to Retirement’ Prompt Input. They are static metrics showing the number of employees Eligible Now, in 1 Yr, 3 Yrs. and 5 Yrs.
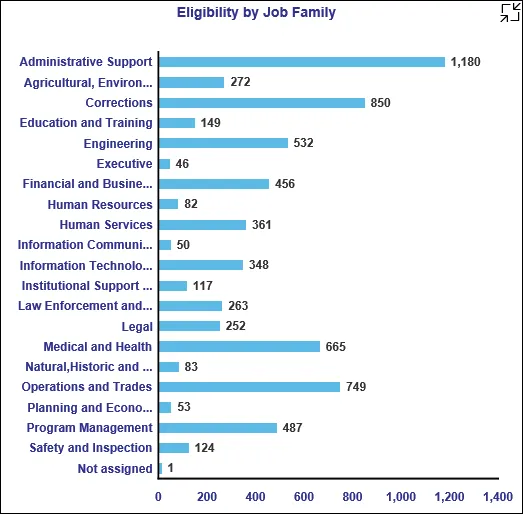
- Horizontal Bar Chart showing eligibility counts by Job Family.
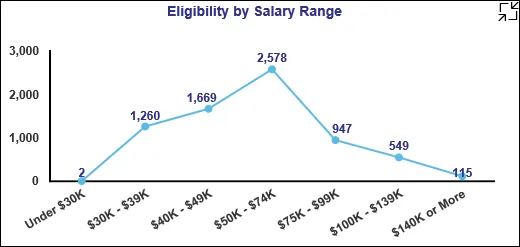
- Line Chart showing eligibility counts by Salary Range.
Note: All employee salaries are annualized for this metric, i.e. part-time salaries are annualized to full-time for representation.
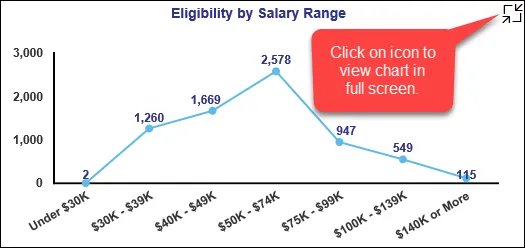
Each chart contains an icon in the upper right corner to enable expansion of the chart to full-screen view.
Demographics Tab
Below is a sample of the dashboard charts under the Demographics tab:
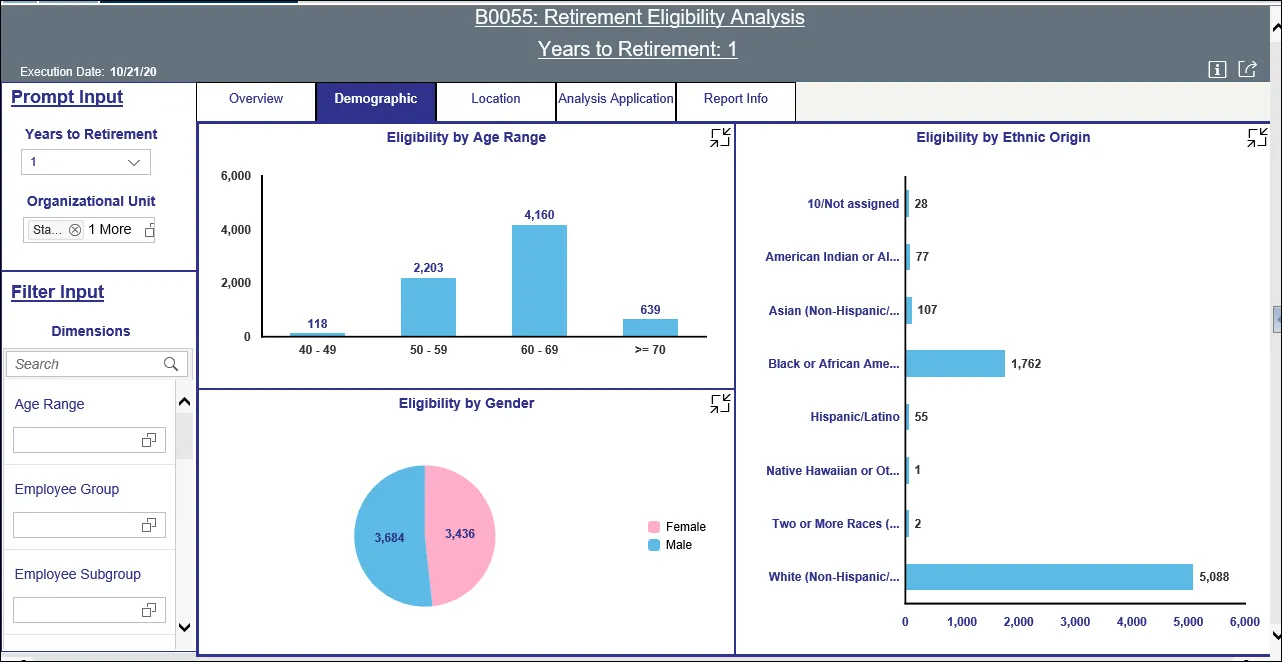
There are three data components displayed in this tab.
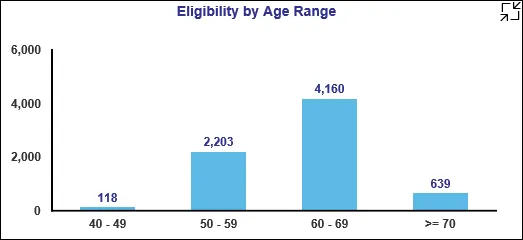
- Vertical Bar Chart showing Eligibility counts by Age Range.
Note: Data for the entire dashboard is filtered to include employees age 40 or higher only.
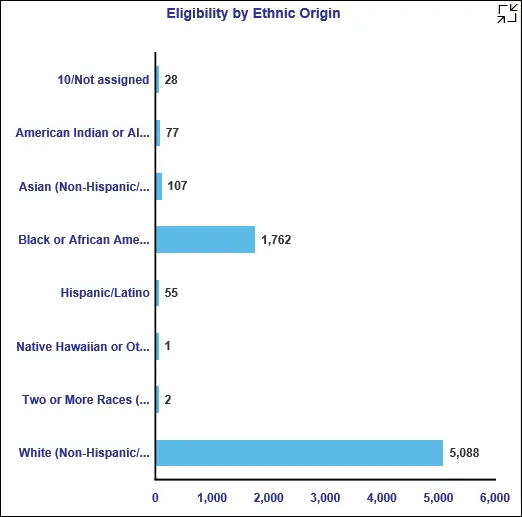
- Horizontal Bar Chart showing Eligibility counts by Ethnic Origin.
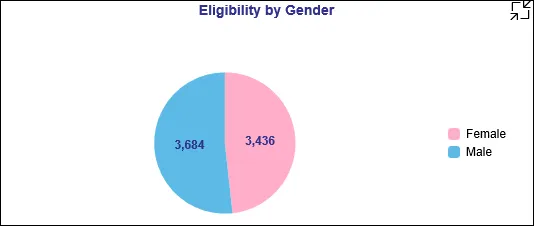
- Pie Chart showing Eligibility counts by Gender.
Location Tab
This tab shows a heat map with Pct Eligible metrics correlated to counties in North Carolina.
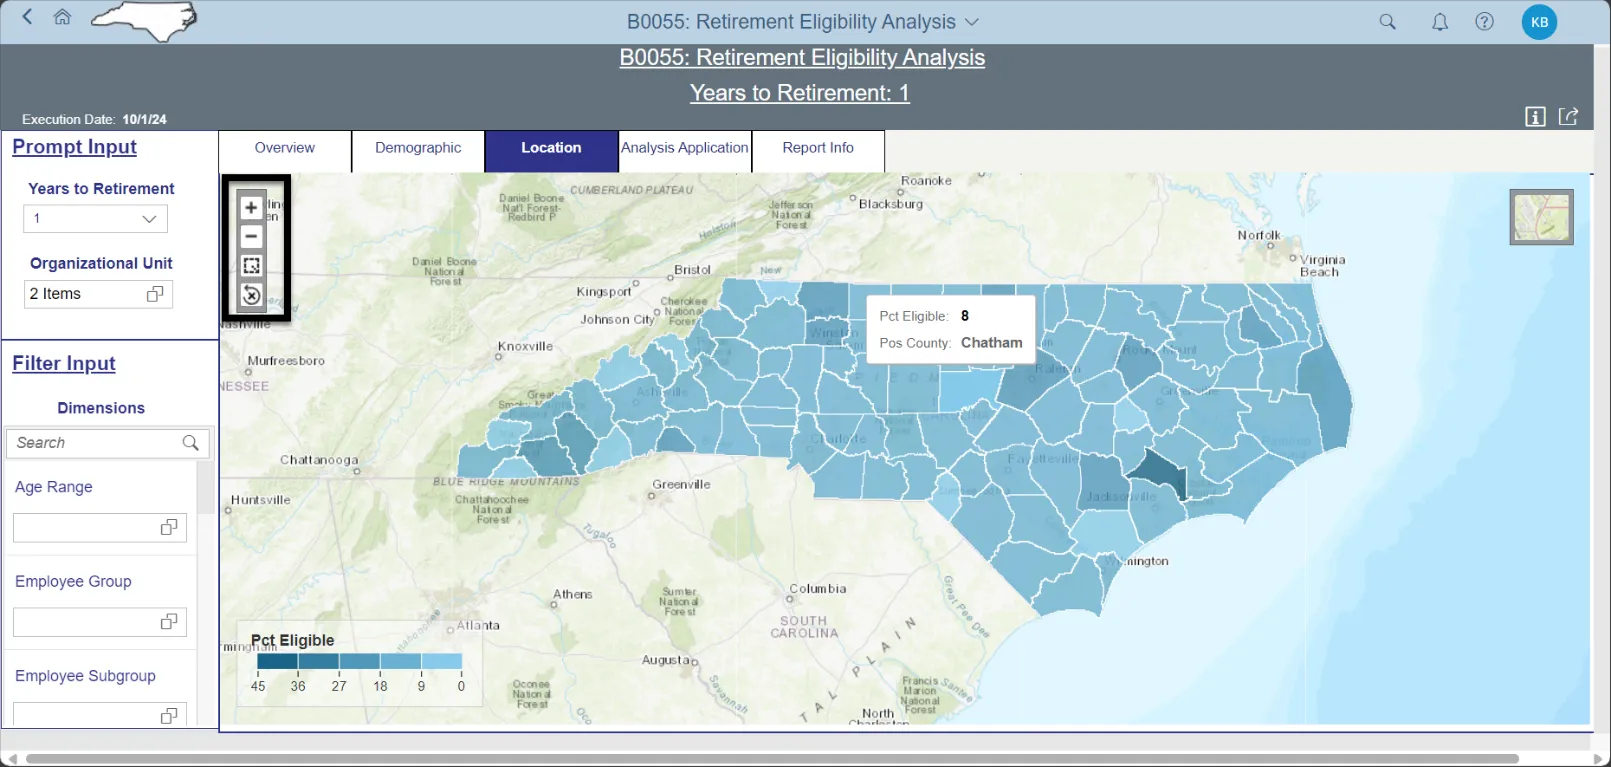
- Hovering over any county will display the metric for that county
- The upper left corner has the zoom controls
Analysis Application Tab
The Analysis Application tab is an interactive interface to manipulate the data table on the workspace to customize this data view.
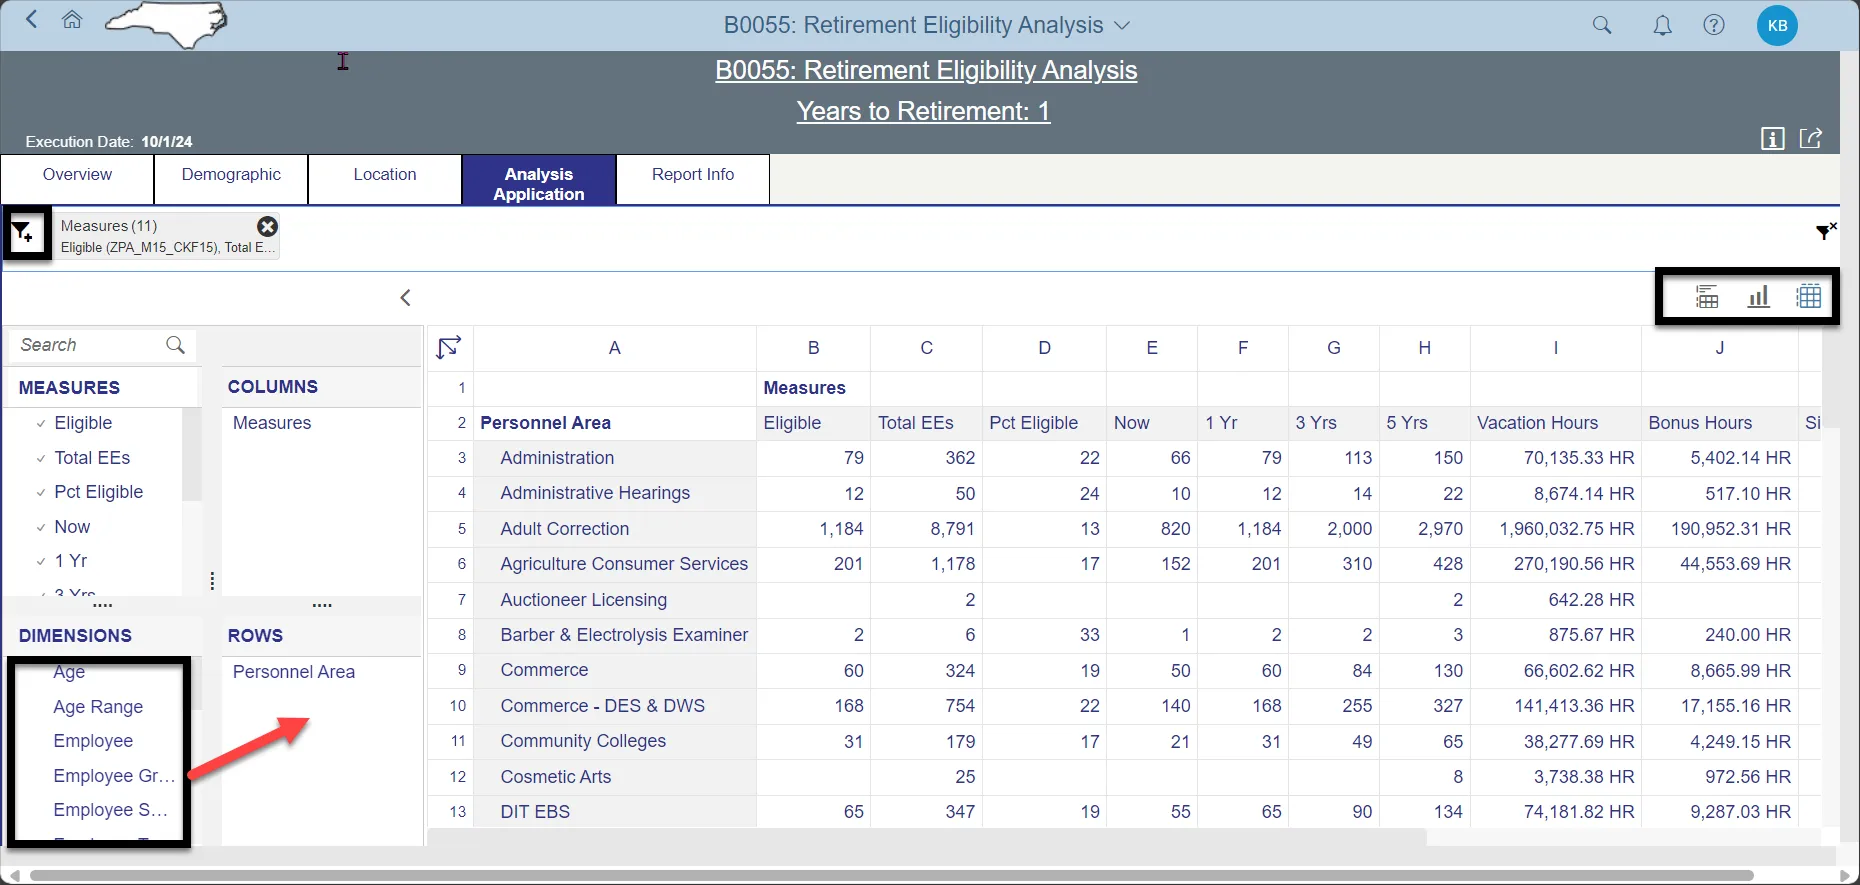
- Dimensions can be dragged into the ‘ROWS’ area to customize the data table
- The funnel icon can be used to apply additional dimension filters to the data set
- NOTE: Applying filters in this tab will affect the data on all other tabs also (Overview, Demographics, Location).
- Upper right corner has controls to enable switching your data view to a different type of chart or table
Additional Standard Controls
The upper right corner contains two standard controls available.

- The Info icon displays the information about the dashboard.
- The Export icon allows exporting to various formats.
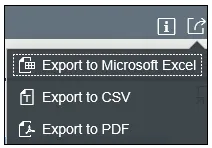
- Export to PDF will export images from the current active tab.
Note: PDF export of heat map in Location tab is not available. The heat map image can be captured via screenshot if desired.
Special Report Considerations/Features
- Only active employees are selected.
- Temporary employees are excluded.
- Judicial consolidated employees are excluded.
- Sick hours are included in the Eligibility determination.
- Employees less than age 40 are excluded.
- Employee Type is a custom dimension for easy filtering of LEO vs Non-LEO employees. LEO employees are defined using the following employee Groups:
- B – Spa Law Enforcement
- L – EPA Law Enforcement
- Q – SPA LEO Bi-Weekly
- S – EPA LEO Bi-Weekly
- All other employee groups are defined as Non-LEO.
- Source data for this dashboard is refreshed weekly on Saturdays.