Purpose
The purpose of this Report Description is to describe the EEO Planning by Org Structure report and how to generate it in the system. Report Description {A}.
Report Description
This report provides demographic information such as ethnic origin and gender along with EEO and State SOC Categories. The report displays organizational structure data by Personnel Area, State SOC Category, State SOC Subcategory and Job.
Report Location
PA: EEO
Report Uses
- The report is useful in analyzing various characteristics such as race/gender/age range as it relates to various factors.
- The report is used to make comparisons by Job, Ave. Salary, Ave. Age and Ave. Length of Service.
- The report is useful in analyzing decisions related to internal equity and any disparity in an agency’s salary decisions, etc.
How to Generate This Report
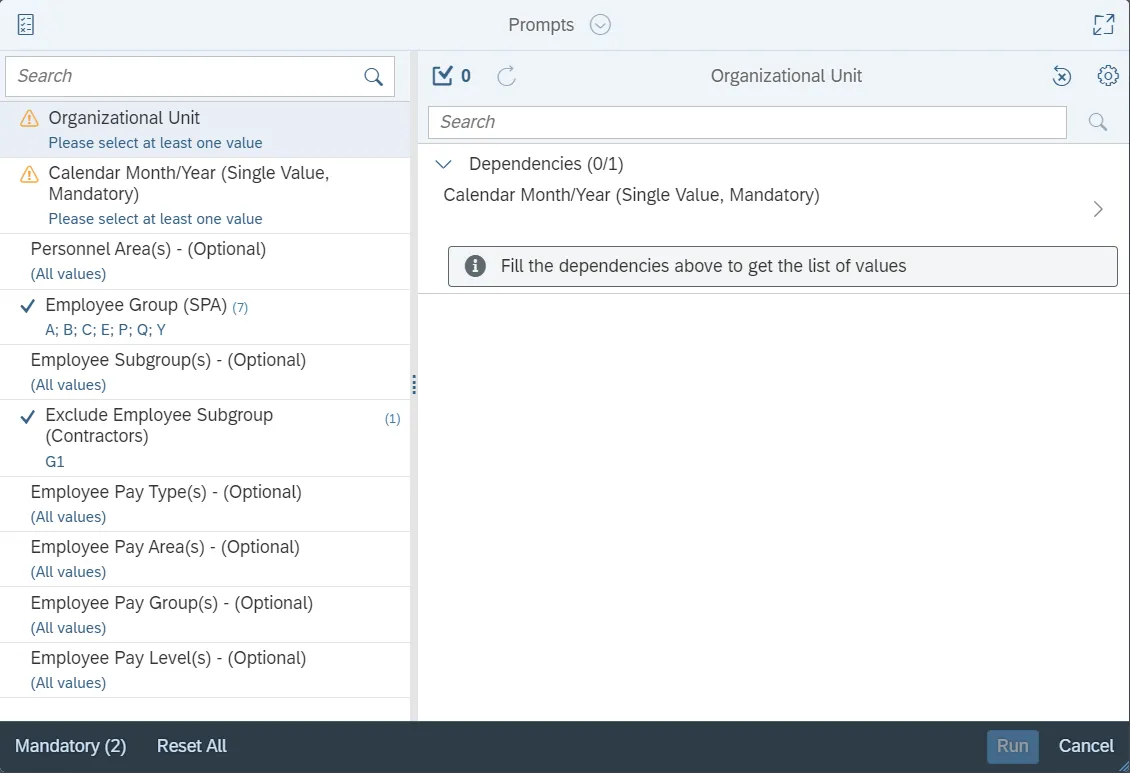
This report is generated after selecting values for the mandatory prompts. All mandatory prompts must have values selected before the Run Icon can be used to generate the report. Mandatory prompts can be identified as mandatory by the exclamation mark inside of the yellow-orange triangle, the square with the checkmark, or the display of (Mandatory). Detailed instructions for interaction with each prompt can be found on the Web Intelligence Prompt List on the OSC website.
The Mandatory prompts for this report are:
- Organizational Unit
- Calendar Month/Year (Single Value, Mandatory)
This report can also be further limited by utilizing the Optional prompts to further limiting the amount of data that retrieved into the body of the report. Optional prompts are indicated as optional in parentheses beside the prompt.
The Optional prompts are:
- Personnel Area(s) - (Optional)
- Employee Group (SPA)
- Employee Subgroup(s) - (Optional)
- Employee Pay Type(s) - (Optional)
- Employee Pay Area(s) - (Optional)
- Employee Pay Group(s) - (Optional)
- Employee Pay Level(s) - (Optional)
Exclusion prompts exclude specified data by default while allowing customers the flexibility of changing them when necessary. Exclusion prompts are identified by the term Exclude followed by the prompt.
The Exclusion prompts are:
- Exclude Employee Subgroup (Contractors)
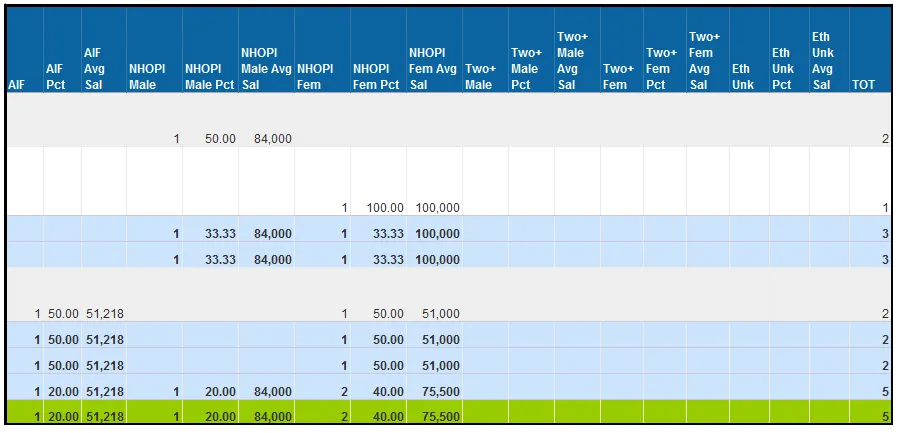
Initial Layout
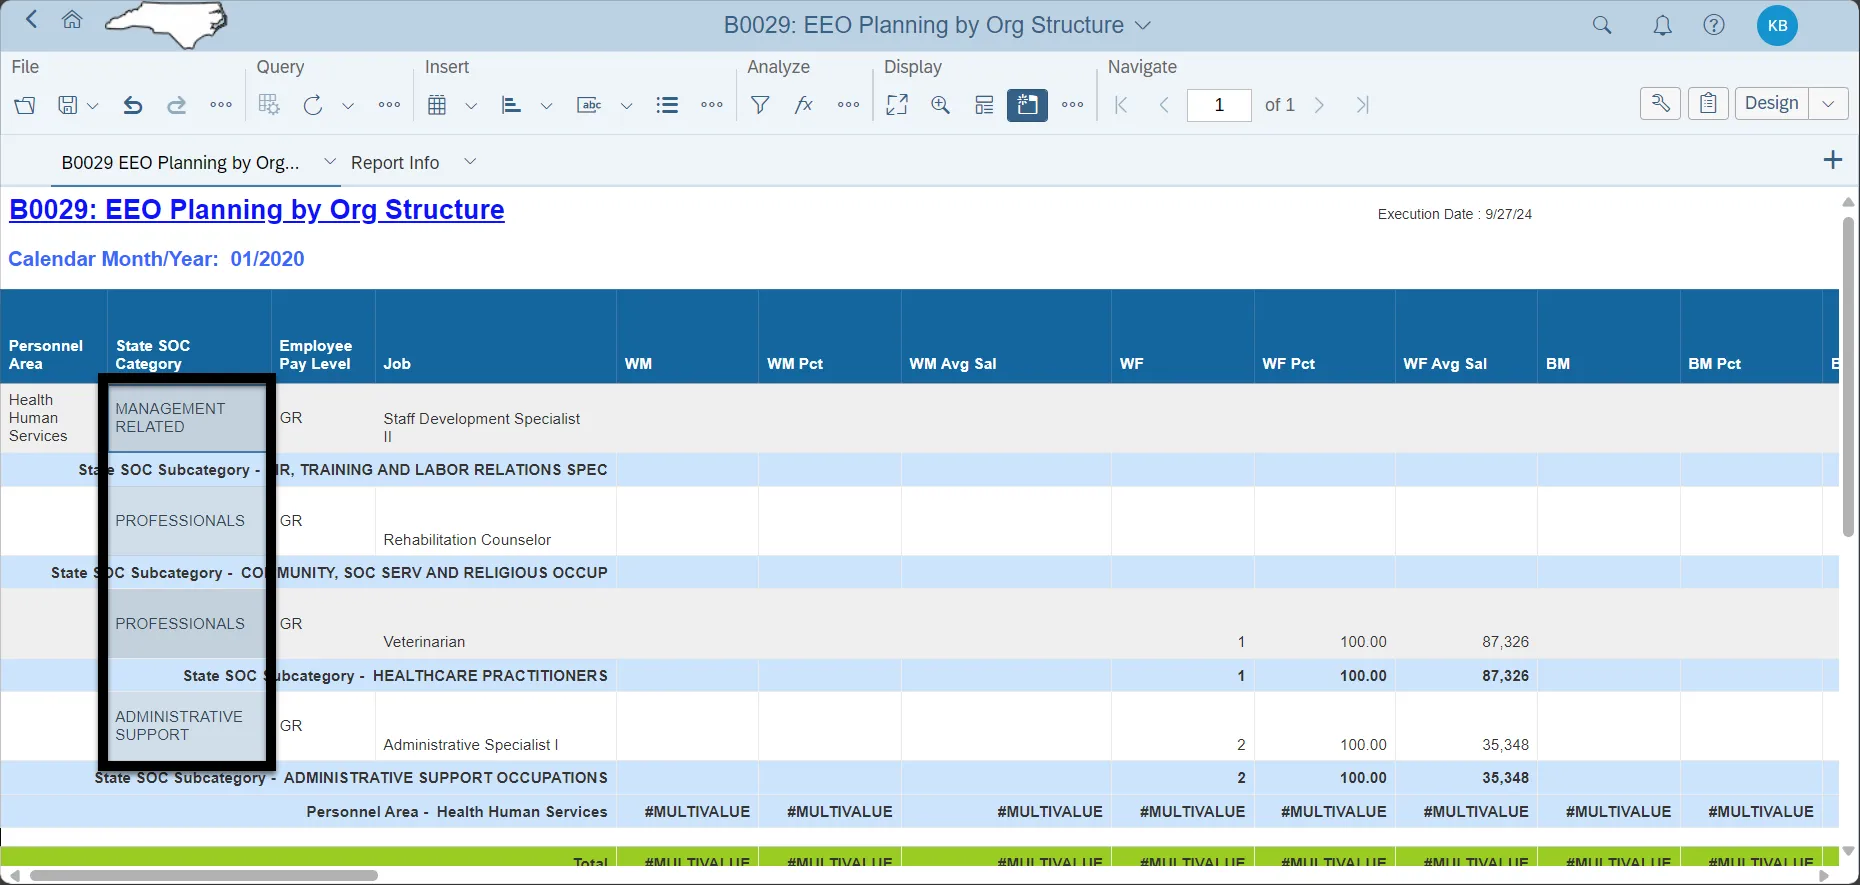
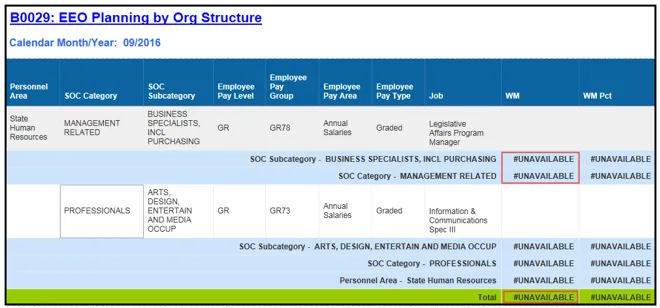
EEO Planning by Org Structure: This report provides demographic Information such as ethnic origin and gender along with EEO and State SOC Categories. The report displays organizational structure data by Personnel Area, State SOC Category, State SOC Subcategory, and Job.
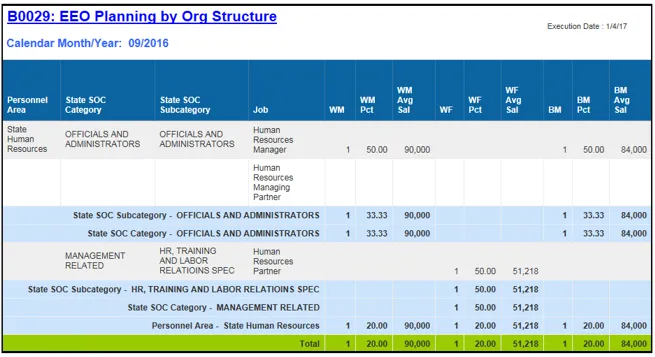
Continued...
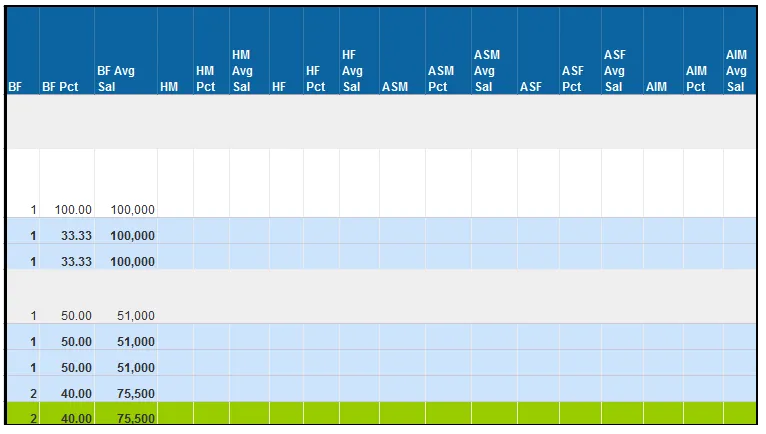
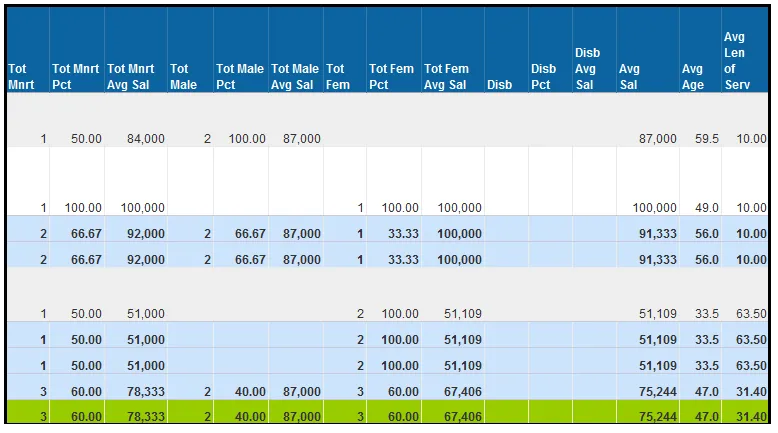
Continued...
Continued...
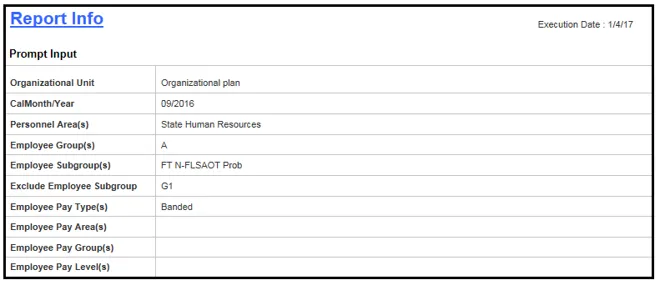
The Report Info tab displays information about the prompts entered.
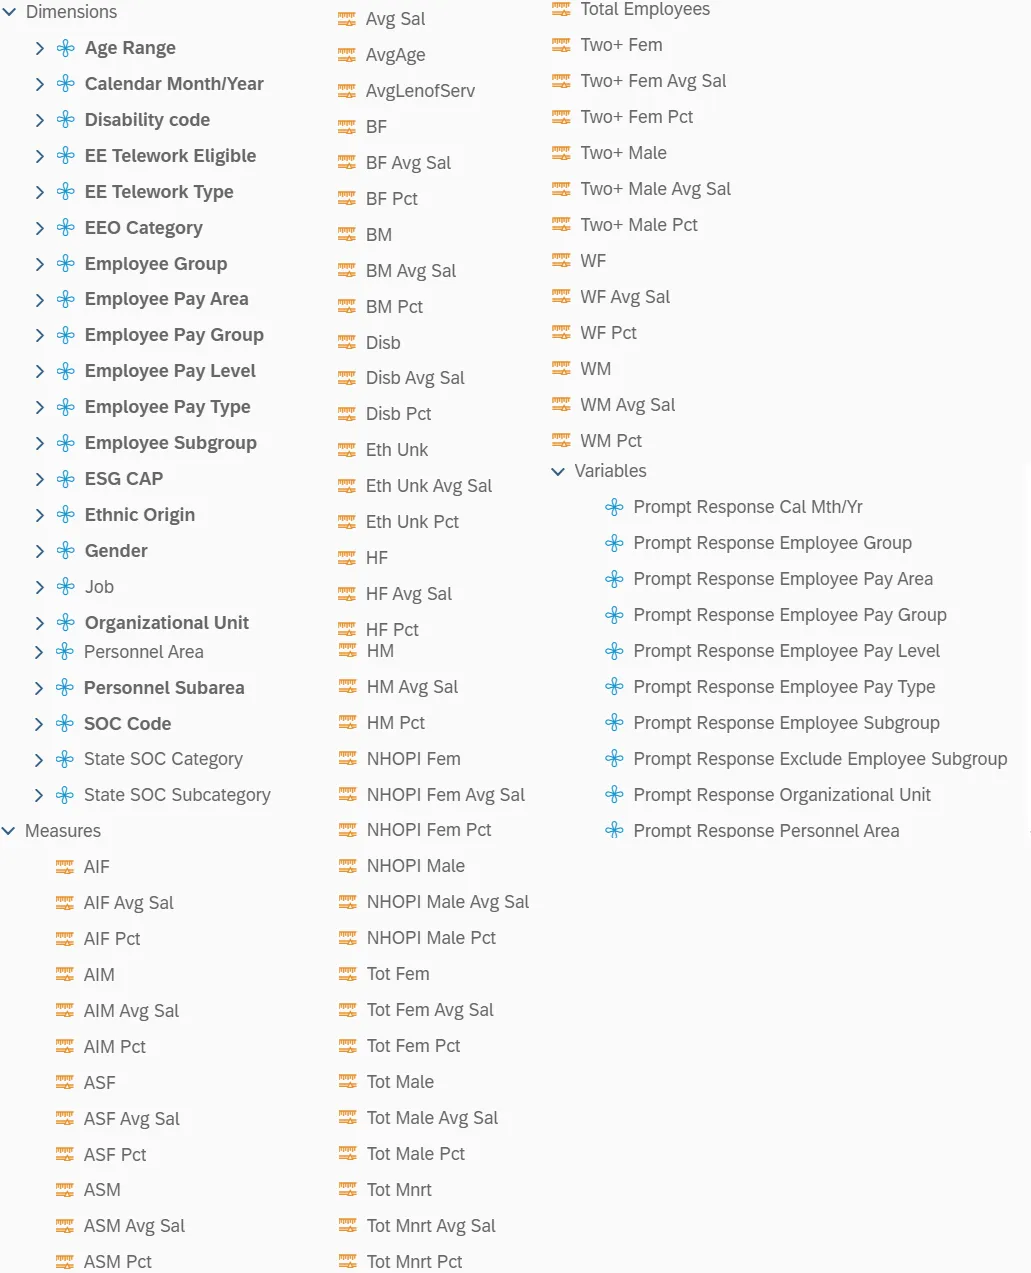
Available Objects
This is a list of the available objects that can be added to the report, from the Document Dictionary once in the Design mode:
Dimensions
- Age Range
- Calendar Month/Year
- Disability code
- EE Telework Eligible
- EE Telework Type
- EEO Category
- Employee Group
- Employee Pay Area
- Employee Pay Group
- Employee Pay Level
- Employee Pay Type
- Employee Subgroup
- ESG CAP
- Ethnic Origin
- Gender
- Job
- Organizational Unit
- Personnel Area
- Personnel Subarea
- SOC Code
- State SOC Category
- State SOC Subcategory
Measures
- AIF
- AIF Avg Sal
- AIF Pct
- AIM
- AIM Avg Sal
- AIM Pct
- ASF
- ASF Avg Sal
- ASF Pct
- ASM
- ASM Avg Sal
- ASM Pct
- Avg Sal
- AvgAge
- AvgLenofServ
- BF
- BF Avg Sal
- BF Pct
- BM
- BM Avg Sal
- BM Pct
- Disb
- Disb Avg Sal
- Disb Pct
- Eth Unk
- Eth Unk Avg Sal
- Eth Unk Pct
- HF
- HF Avg Sal
- HF Pct
- HM
- HM Avg Sal
- HM Pct
- NHOPI Fem
- NHOPI Fem Avg Sal
- NHOPI Fem Pct
- NHOPI Male
- NHOPI Male Avg Sal
- NHOPI Male Pct
- Tot Fem
- Tot Fem Avg Sal
- Tot Fem Pct
- Tot Male
- Tot Male Avg Sal
- Tot Male Pct
- Tot Mnrt
- Tot Mnrt Avg Sal
- Tot Mnrt Pct
- Total Employees
- Two+ Fem
- Two+ Fem Avg Sal
- Two+ Fem Pct
- Two+ Male
- Two+ Male Avg Sal
- Two+ Male Pct
- WF
- WF Avg Sal
- WF Pct
- WM
- WM Avg Sal
- WM Pct
Variables
- Prompt Response Cal Mth/Yr
- Prompt Response Employee Group
- Prompt Response Employee Pay Area
- Prompt Response Employee Pay Group
- Prompt Response Employee Pay Level
- Prompt Response Employee Pay Type
- Prompt Response Employee Subgroup
- Prompt Response Exclude Employee Subgroup
- Prompt Response Organizational Unit
- Prompt Response Personnel Area
List of Ethnic Categories Displayed in the Report
| Ethnic Categories | Full Form |
|---|---|
| WM | White Male |
| WF | White Female |
| BM | Black Male |
| BF | Black Female |
| HM | Hispanic/Latino Male |
| HF | Hispanic/Latino Female |
| ASM | Asian Male |
| ASF | Asian Female |
| AIM | American Indian or Alaskan Native Male |
| AIF | American Indian or Alaskan Native Female |
| NHOPI Male | Native Hawaiian or Other Pacific Islander Male |
| NHOPI Female | Native Hawaiian or Other Pacific Islander Female |
| Two+ Male | Two or More Races Male |
| Two+ Female | Two or More Races Female |
| Eth Unk | Ethnic Unknown |
| Disb | Disabled |
Special Report Considerations/Features
Only active employees are included on this report.
- Average Age is displayed with One Decimal Place and Average Length of Service is displayed in two decimal places in this report.
- Please do not apply Report Filters on Compounded Pay Elements like Employee Pay Groups and Employee Pay Levels. Use the Prompt Selections if you want to filter on the above Compounding Pay Elements.
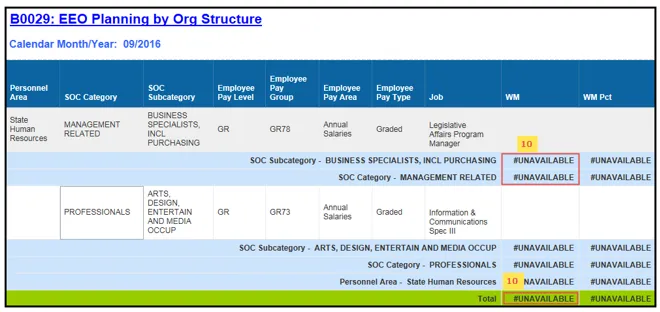
- You will receive the #UNAVAILABLE error in Sub-totals and Grand totals when you apply Report Filters on the above Compounding Pay Elements. See example below:
- Applying Report Filters:
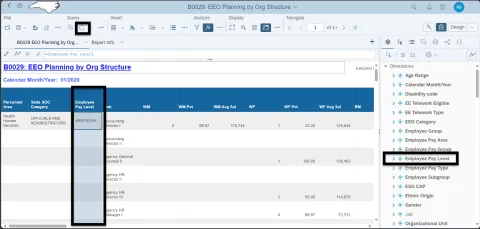
Step 1 - Make sure that Design Mode is on
Step 2 - Drag the available object “Employee Pay Level” from the document dictionary into the report
Step 3 - Click the refresh icon and click run when the prompt summary appears
Step 4 - Right click on a cell in the "Employee Pay Level column
Step 5 - Select Data
Step 6 - Select Add Filter or Remove Filter
Step 7 - Select the desired pay levels and click OK

Step 8 -Refresh the Query and select run when the prompt summary menu opens.

Step 9 - Note the #MULTIVALUE error in Sub-totals and Grand totals of the Report
- To change the breaks in the Report while exporting the data to Excel:
- By default, breaks are applied in the report on Personnel Area, State SOC Category, and State SOC Subcategory to avoid repeated values in the column.
- To see the repeated values for above columns in Excel, remove the break(s) in the report before exporting the data to Excel.
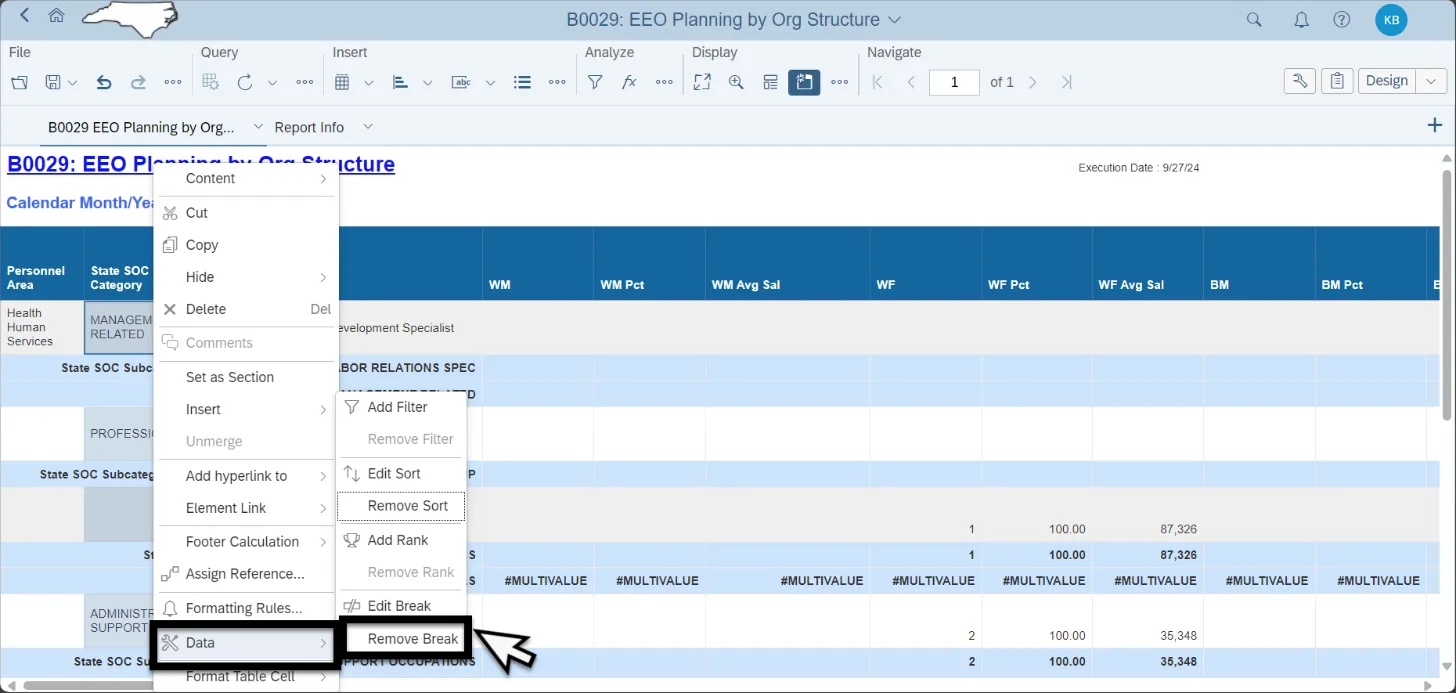
Step 1 - Make sure that Design Mode is on
Step 2 - Left click to select the desired column
Step 3 - Right click in the desired column
Step 4 - Select Data from the right click menu
Step 5 - Select Remove Break from the right click menu
Step 6 - Click on "Remove Break"
Step 7 - The repeated values in all columns will be visible and can be exported to Excel in the same format.