Purpose
The purpose of this report description is to explain the purpose of and how to generate the Compensation Modeling report.
Report Description
This report allows OSHR to analyze the cost of implementing the new Compensation System with cost information regarding taking employees to new MIN or new MP.
Report Location
OSHR Executive Oversight
Report Use
- Tool to be used specifically for calculating the cost of proposed reallocation actions. The unique data being pulled into the report is the set of relationships between Positions and the proposed Jobs to which they can be reallocated. Knowing the proposed Jobs allows the report to compare the salary of Employees in these Positions to the salary range associated with the Jobs and then calculate the difference between the salary and the salary range minimum and midpoint. These difference amounts can then be grouped by funding source and totaled as needed to determine how much money would be needed to increase Employees’ salaries to the minimum and/or midpoint.
- The ‘No Job Chg’ flag is set when the New Job is the same as the Current Job or if the New Job is an existing Job. This flag can be used to identify any reallocations that may have been entered incorrectly in the Agency spreadsheets.
How to Generate this Report
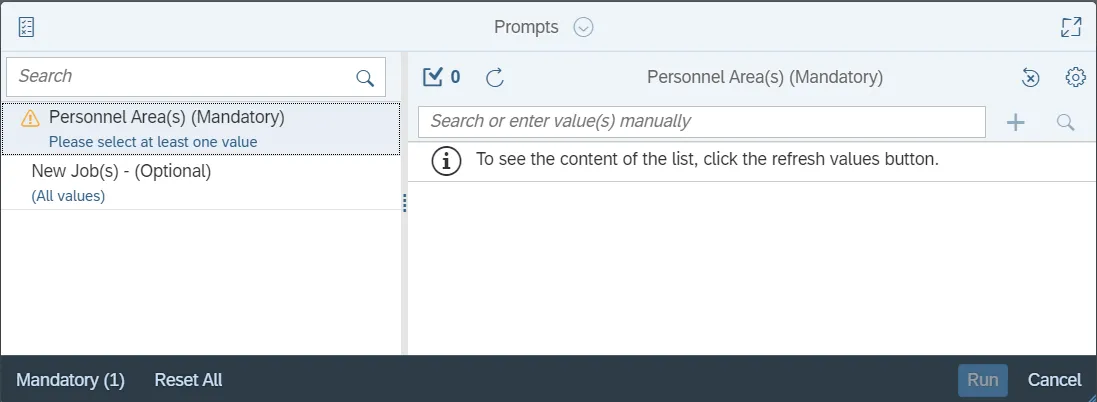
This report is generated after selecting values for the mandatory prompts. All mandatory prompts must have values selected before the Run Icon can be used to generate the report. Mandatory prompts can be identified as mandatory by the exclamation mark inside of the yellow-orange triangle, the square with the checkmark, or the display of (Mandatory). Detailed instructions for interaction with each prompt can be found on the Web Intelligence Prompt List on the OSC website.
The Mandatory prompts for this report are:
- Personnel Area(s) (Mandatory)
This report can also be further limited by utilizing the Optional prompts to further limiting the amount of data that retrieved into the body of the report. Optional prompts are indicated as option in parentheses beside the prompt.
The Optional prompts are:
- New Job(s) - (Optional)
Initial Layout
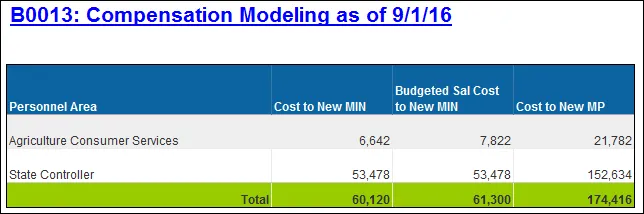
B0013 Compensation Modeling (1st tab): This tab lists the total Cost to New MIN, Budget Cost to New MIN, and Cost to New MP for each agency. Below is a sample rendering.
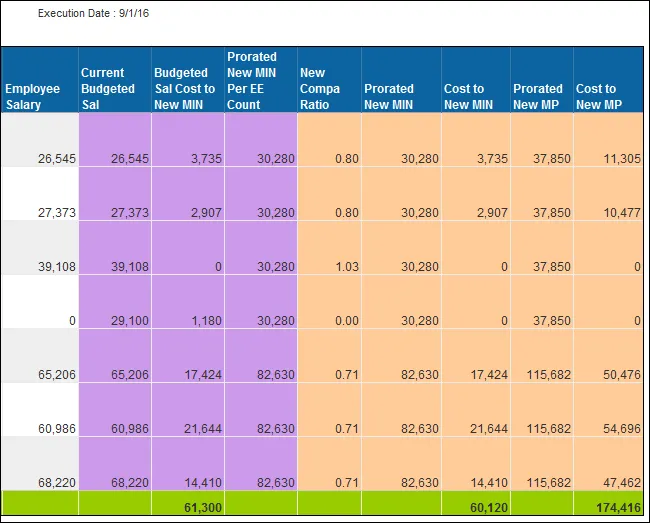
Compensation Modeling Detail (2nd tab): This tab lists all Positions, Employee, New Job, and corresponding costs to bring employees or positions to New Job Minimum or New Job MP (midpoint). Below is a sample rendering.
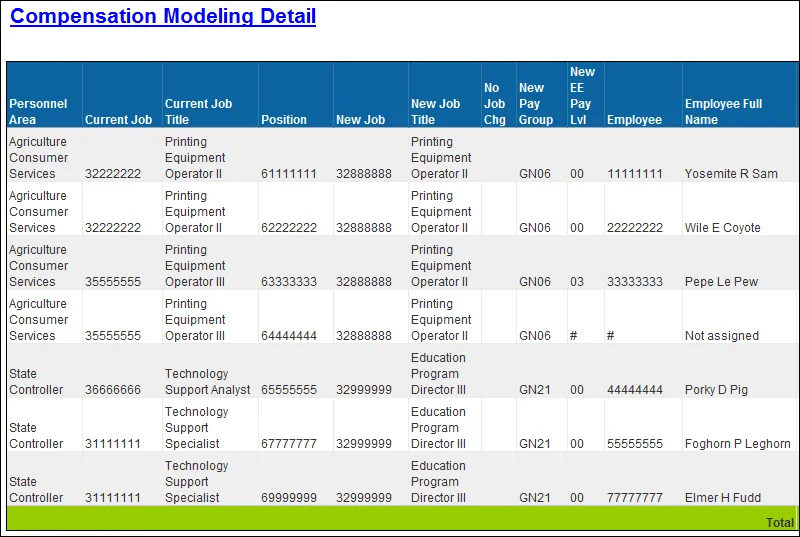
Compensation Modeling Detail (2nd tab) Continued…
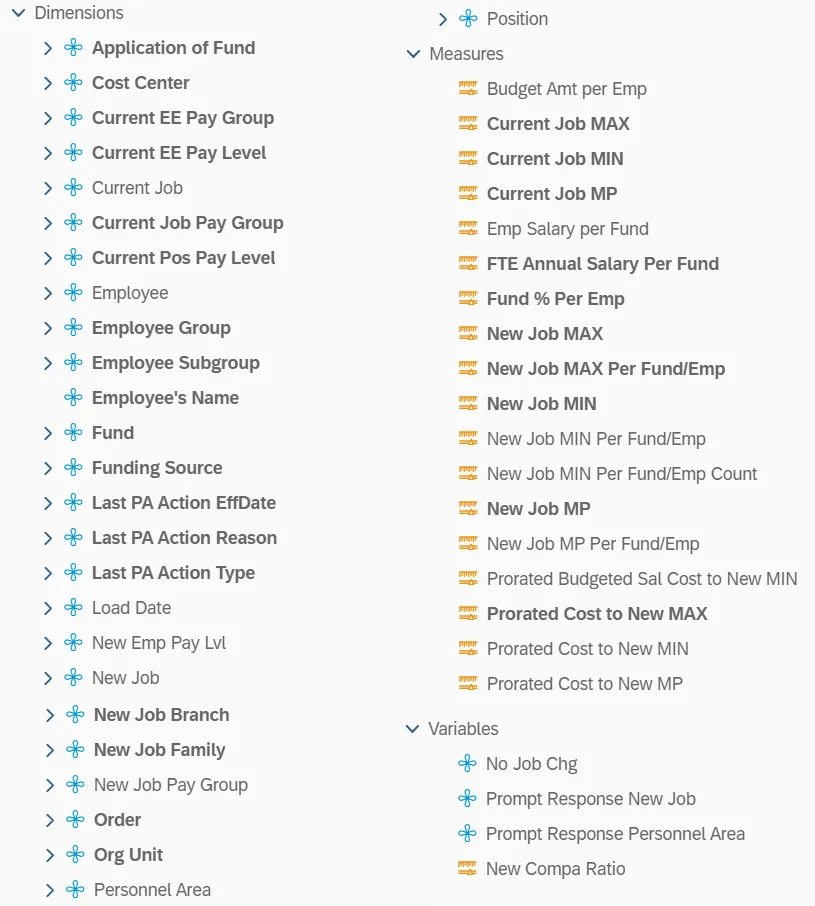
Available Objects
This is a list of the available objects that can be added to the report, from the Document Dictionary once in the Design mode:
Dimensions
- Application of Fund
- Cost Center
- Current EE Pay Group
- Current EE Pay Level
- Current Job
- Current Job Pay Group
- Current Pos Pay Level
- Employee
- Employee Group
- Employee Subgroup
- Employee’s Name
- Fund
- Funding Source
- Last PA Action EffDate
- Last PA Action Reason
- Last PA Action Type
- Load Date
- New Emp Pay Lvl
- New Job
- New Job Branch
- New Job Family
- New Job Pay Group
- Order
- Org Unit
- Personnel Area
- Position
Measures
- Budget Amt per Emp
- Current Job MAX
- Current Job MIN
- Current Job MP
- Emp Salary per Fund
- FTE Annual Salary Per Fund
- Fund % Per Emp
- New Job MAX
- New Job MAX Per Fund/Emp
- New Job MIN
- New Job MIN Per Fund/Emp
- New Job MIN Per Fund/Emp Count
- New Job MP
- New Job MP Per Fund/Emp
- Prorated Budgeted Sal Cost to New MIN
- Prorated Cost to New MAX
- Prorated Cost to New MIN
- Prorated Cost to New MP
Variables
- No Job Chg
- Prompt Response New Job
- Prompt Response Personnel Area
- New Compa Ratio
Special Report Considerations/Features
- The employee’s sortable name (Employee’s Name) is available to drag on to the report but cannot be used if running statewide; this causes performance issues. This object can be used only if running for individual agencies or groups of agencies.
- Judicial Branch (PersArea 0201) and School of Science and Math (PersArea 8701) are excluded.
- New Emp Pay Lvl is derived by comparing the employee’s current FTE Annual Salary to the Salary Table entries representing the Quartiles for the New Job to determine where the employee falls in the new compensation model.
- Note: Because some employees can be part-time, use the FTE Annual Salary to make sure everyone is annualized before doing the comparison to the new Salary Tables.
- Because the underlying data is granular based on possible fund splits and employees can be part time, we must use the funding percent and employee work percent to prorate the Job Min/Max/MP values before calculating Cost to MIN, MP, or MAX.
The prorated amount relative to employee working percent is calculated as: Fund % (IT9018) x Employee Work % (IT0007) x New Job Min (Max or MP). - Because there can be multiple employees occupying the same position, we must prorate the Job Min based on the possible fund split and employee count before calculating the Budgeted Salary Cost to New MIN.
The prorated Job Min relative to employee count is calculated as: Fund % (IT9018) x Employee Count Per Position (IT1001) x New Job Min. - Compa Ratio is calculated as follows: (Emp. Salary per Fund + Prorated Cost to New MIN) divided by Prorated New MP
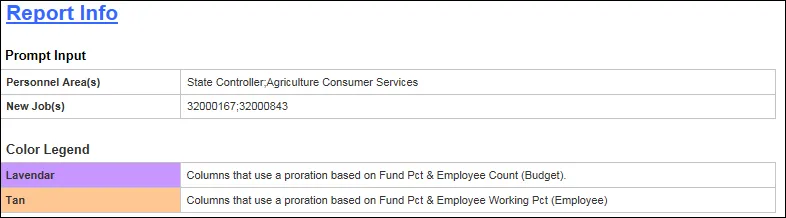
- Columns on the Detail (2nd) tab were color coded to differentiate between calculations relative to Budget vs calculations relative to Employee. The color legend appears on the Report Info tab.
- The following measures would produce nonsensical results if summed:
- Compa Ratio
- Current Job MAX
- Current Job MIN
- Current Job MP
- New Job MAX
- New Job MAX Per Fund/Emp
- New Job MIN
- New Job MIN Per Fund/Emp
- New Job MP
- New Job MP Per Fund/Emp
- New Job MIN Per Fund/Emp Count
- Fund % Per Emp: this measure may be summarized for each position but does not make sense to sum as a grand total.