Purpose
The purpose of this report is to display attendance and absence metrics for employees and related payroll posting costs as dashboards in the Integrated HR-Payroll System.
Report Description
This dashboard displays attendance and absence metrics for employees and related payroll posting costs.
Report Location
PT: Quota Payouts
Report Uses
The value of the data provided here allows agencies to tie attendance and absence hours back to actual payroll costs, which are broken out by various dimensions that allow for further details as described below.
Payroll cost data is also useful in determining specific patterns or trends related to overtime or premium pay.
- This dashboard provides leave and actual hours paid analytics in easy-to-read graphs and charts.
- Agency users will see the leave hours and actuals payroll paid metrics in various charts by Wage Type groups for the Selected Month and as well as for Last 12 months in ‘Overview’ tab.
- Report provides Payroll cost metrics by funding source and Employee grouping in ‘Fund Src/Emp Group’ tab.
- County wise specifics of attendance/absence types which details actuals paid grouped by county is provided. The ‘Countywise’ tab represents data by county for premium pay and other specific leave wage type.
- Report has an ‘Analysis Application’ tab that details Actuals Paid measured by Debit/Credit Net. Agency users can use this Analysis Application tab, an interactive interface to manipulate the data table on the workspace and it allows them to customize the data view and present it in charts on their own.
How to Generate This Report
There are no prompts required to generate this dashboard. Click on the report name “B0198: Attendance and Absence Payroll Actuals” in the PT: Quota Payouts folder, and the report will execute.
The dashboard is generated with data contained in multiple tabs. The initial rendering defaults to showing data specific to the agency OrgUnits for which the user has access.
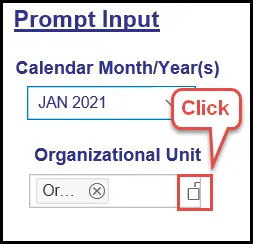
Prompt Input Control
The Prompt Input control has two dimensions which are pre-filled with default values for the initial execution.
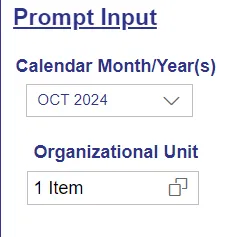
- Calendar Month/Year(s): The default value is set to current month. The value can be changed by using the dropdown arrow.
- Organizational Unit: The default value is the top-level Organizational Unit(s) to which the user has access. The value can be changed by clicking the icon at the end.
Note: Prompt Input values apply to data across all tabs viz Overview, Fund Src/Emp Group, Countywise, and Analysis Application.
Filter Input Control
The Filter Input control contains many dimensions that can be used to further narrow down the data.
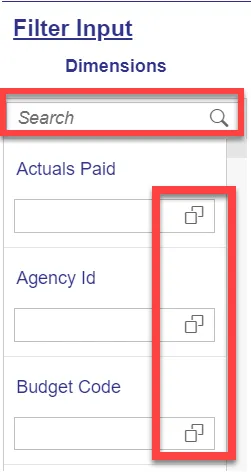
- The Search box allows you to search for specific dimension names.
- Use the icons at the end of each Dimension name to filter for specific values in each Dimension.
- Dimensions Available for Filter Input:
- Actuals Paid
Note: This dimension filter lists various wage type groups identified as Approved Leave, Bonus Leave, etc. The complete list of Wage Type groups and Wage Type list is provided in the Special Report Consideration/Features Section in this document under the heading ‘Actuals Paid – Wage Type Group Listing’. - Agency ID
- Budget Code
- Budget Fund
- Budget Funding Source (OSBM)
- Business Area
- Company Code
- Controlling Area
- Cost Center
- Cost Center Category
- Country Grouping
- Date of Payroll Run
- Document Date
- Document Type
- Employee Group
- Employee Grouping for Acct
- Employee Subgroup
- Financial Key
- For-Period End Date
- For-Period for Payroll
- For-Period Payroll Area
- For-Period Payroll Period Dates
- For-Period Payroll Type
- For-Period Start Date
- Fund
- Fund Type
- Funding Source
- GL Account
- In-Period End Date
- In-Period for Payroll
- In-Period Payroll Area
- In-Period Payroll Period Dates
- In-Period Payroll Type
- Job
- NCAS GL Account
- NCFS GL Account
- NCFS Agency
- NCFS Agency Program
- NCFS AMU
- NCFS Budget Code
- NCFS Budget Fund
- NCFS Funding Source
- NCFS Interfund
- NCFS Project
- NCFS User Define 1
- NCFS User Define 2
- NCFS User Define 3
- Order
- OrgPath – Agency
- OrgPath – Division
- Pay Date for Payroll Result
- Personnel Area
- Personnel Subarea
- Position County Code
- Posting Creation Cal Qtr/Yr
- Posting Creation Cal Yr
- Posting Creation Date
- Posting Creation Fiscal Period/Yr
- Posting Creation Fiscal Yr
- Posting Date
- Run Number
- Wage Type
- Wage Type Category
- Actuals Paid
Note: Filter Input values apply to data across all tabs viz Overview, Fund Src/Emp Group, Countywise, and Analysis Application.
Overview Tab
Below is a sample of the dashboard charts under the Overview tab:
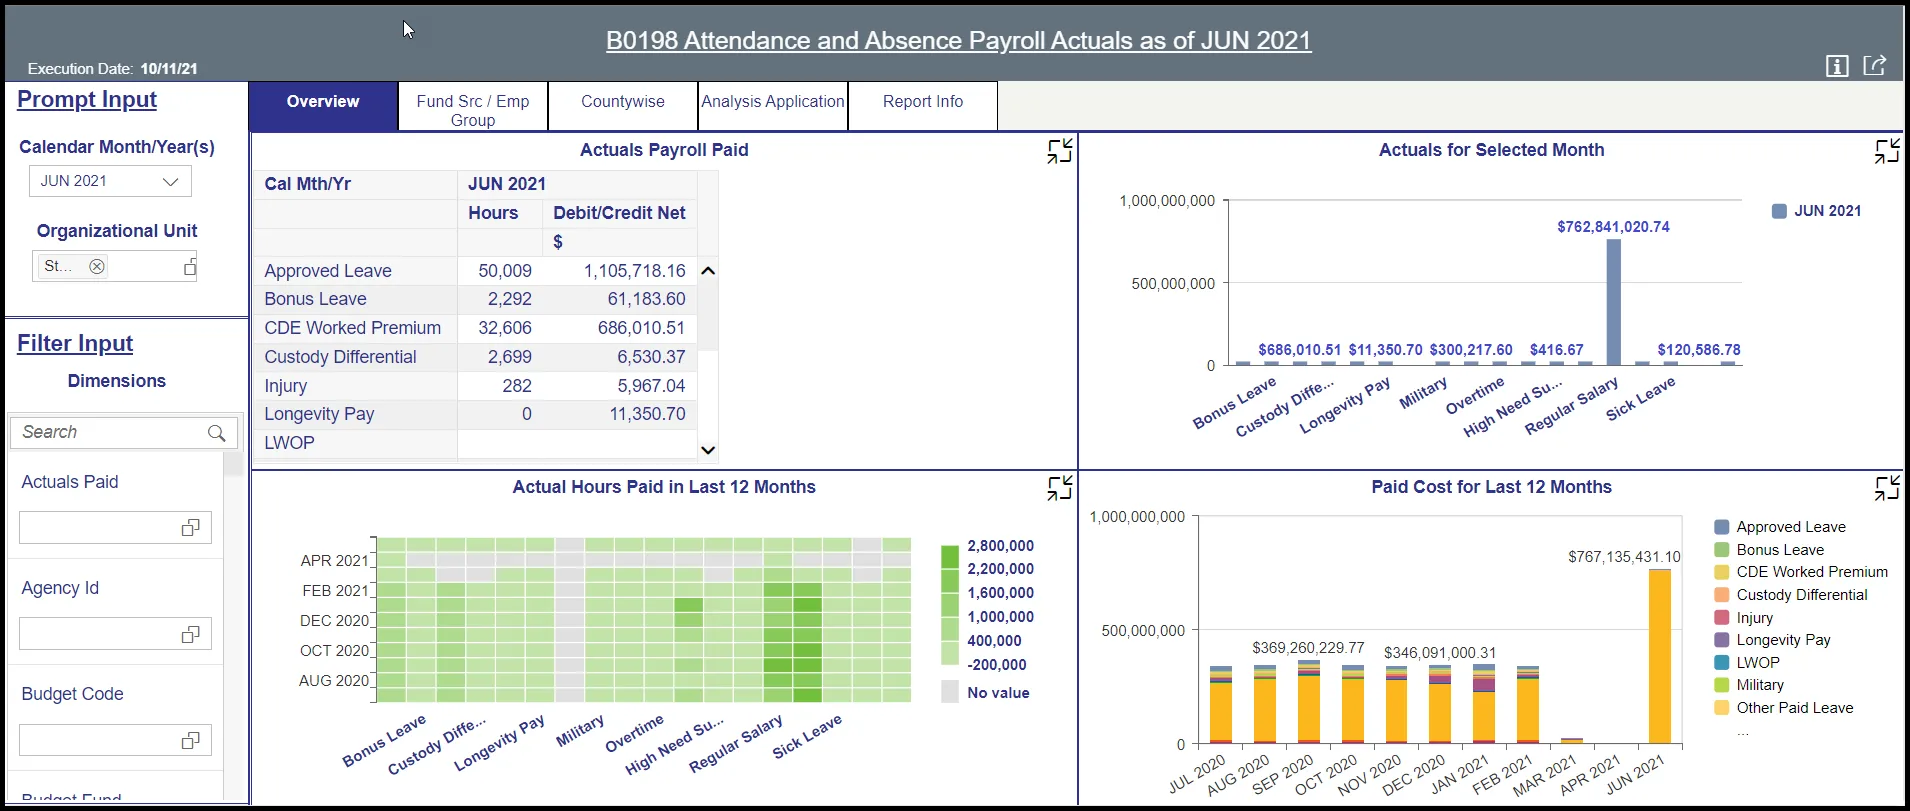
There are four data components displayed in this tab.
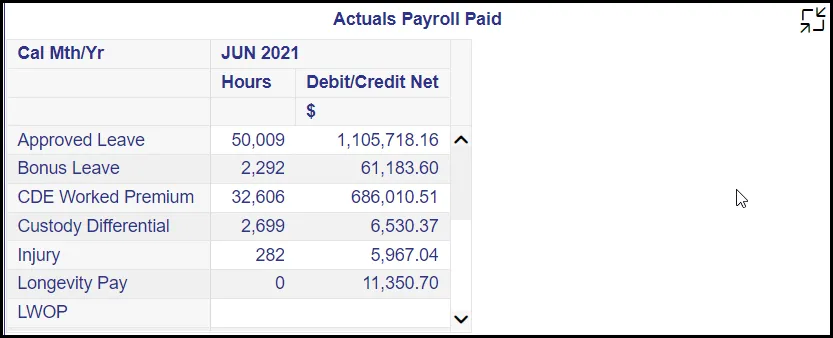
- Spreadsheet component showing Actuals Payroll Paid metrics by Wage Type Group.
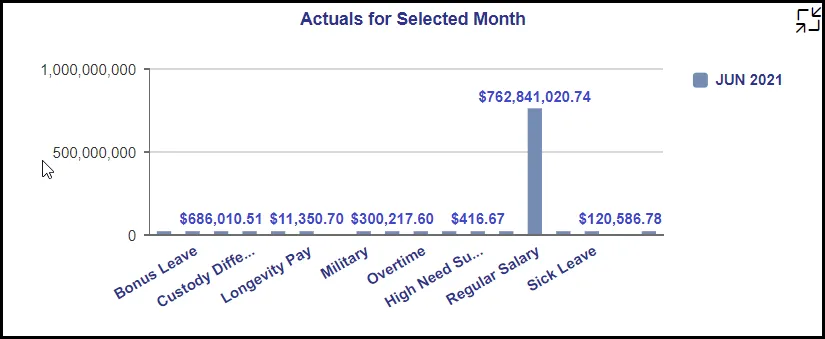
- Column Bar Chart showing Actuals for Selected Month in dollars.
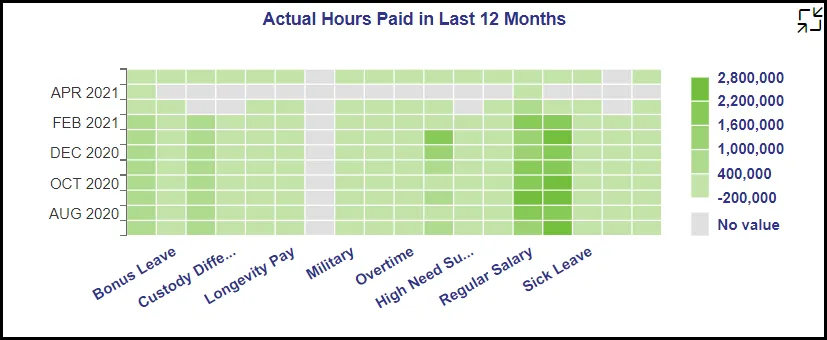
- Heat Map Chart showing Actual Hours Paid in last 12 months.
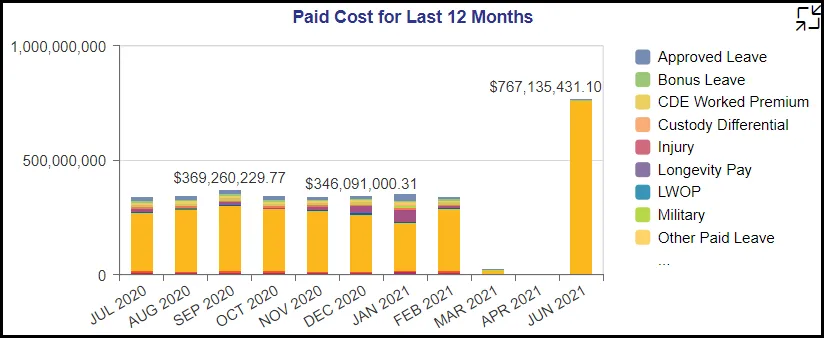
- Stacked Column Chart showing Paid Cost for Last 12 months.
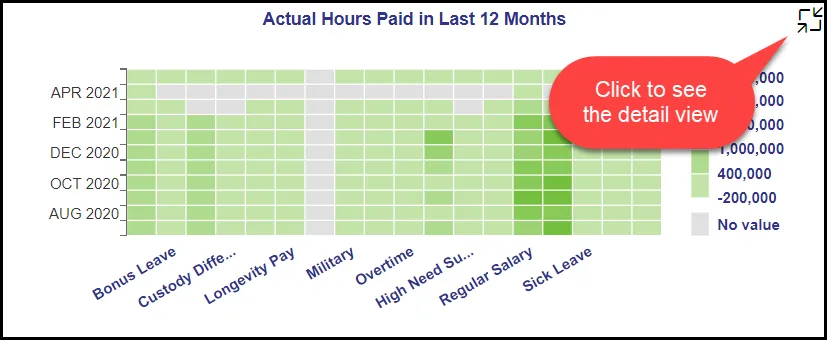
Many charts do have an icon in the upper right corner to enable expansion of the chart to see a full-screen view.
Note:
- Detailed view icon on ‘Actuals Payroll Paid’ spreadsheet will show a full screen view of the same metrics for the last twelve months starting with the Calendar Month/Year selected in the Prompt Input.
- Detailed view icon on ‘Actuals for Selected Month’ chart will show a full screen view of a Heat Map chart showing Payroll Actuals Paid in dollars for the last twelve months as of from the Calendar Month/Year chosen in Prompt Input.
- Detailed view icon on ‘Actual Hours Paid in Last 12 Months’ chart will show the same in a full screen view.
- Detailed view icon on ‘Paid Cost for Last 12 Months’ chart will show the same in a full screen view with the title ‘Actual Total Costs Paid in Last 12 Months’.
Fund Src/Emp Group Tab
Below is a sample of the dashboard charts under the Fund Src/Emp Group tab:
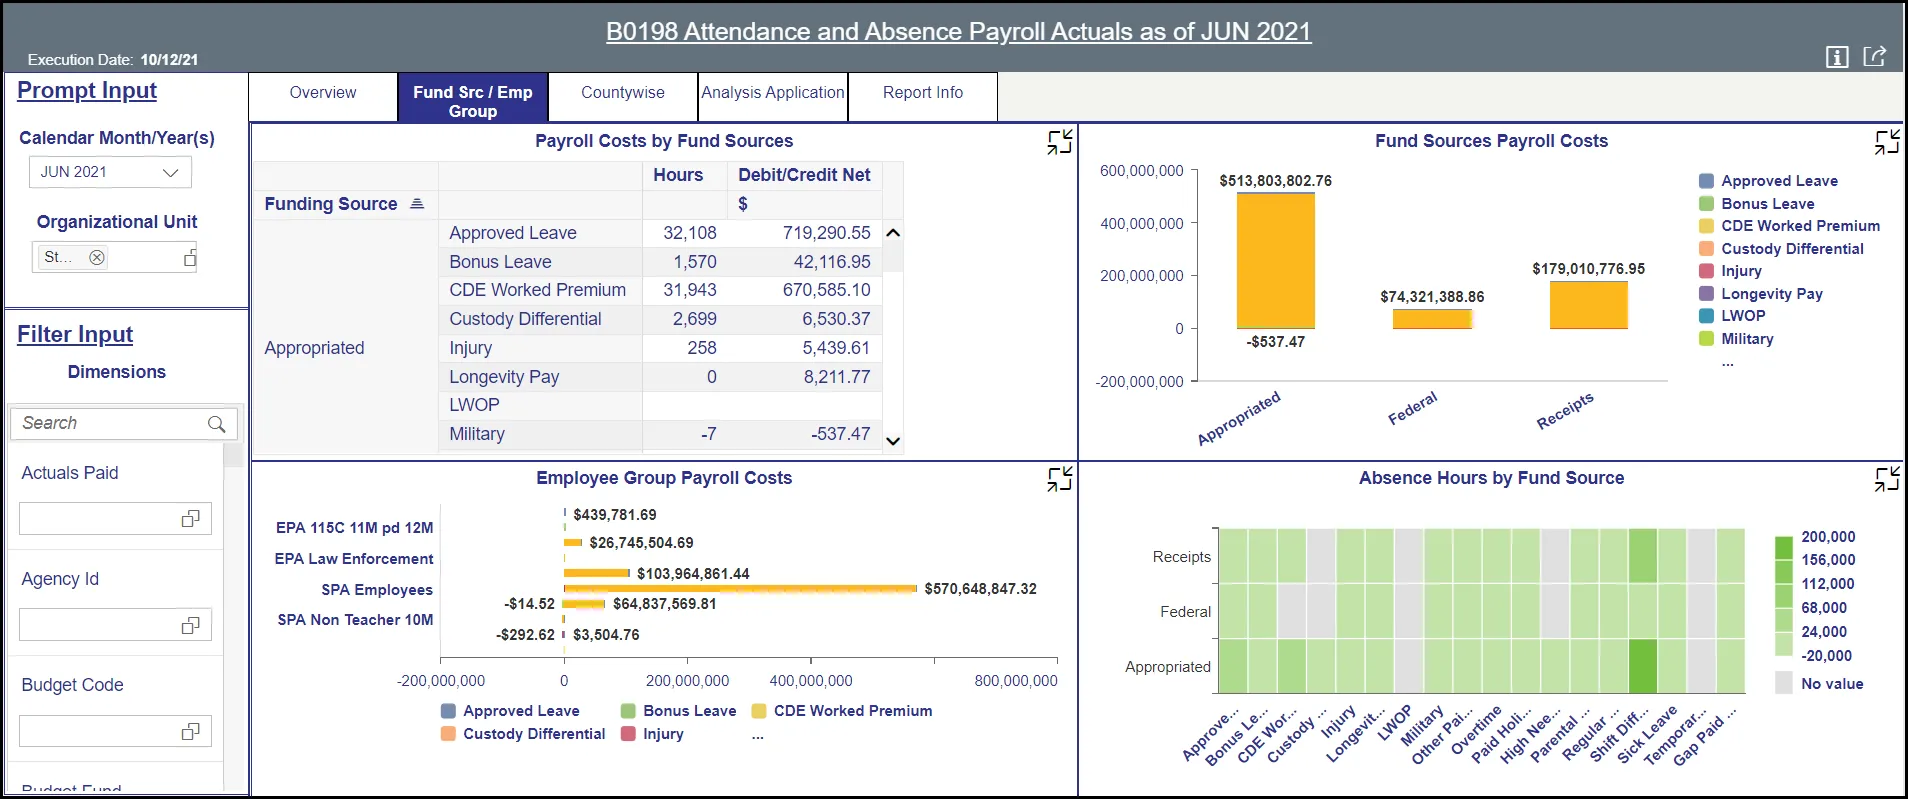
There are four data components displayed in this tab.
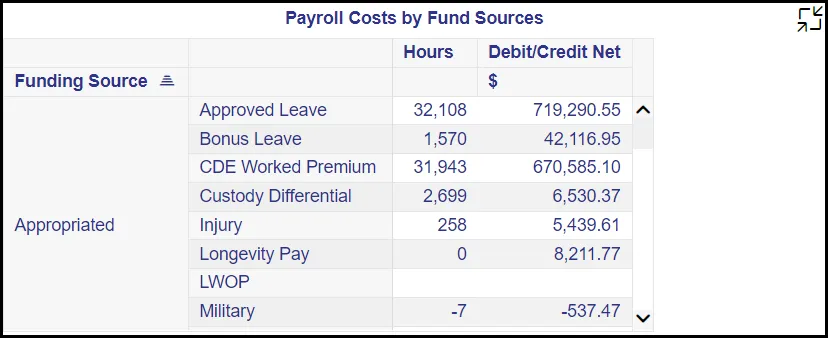
- Spreadsheet component showing Payroll Costs by Fund Sources.
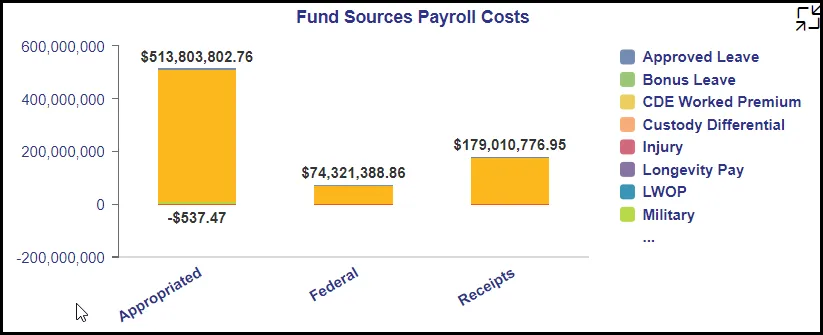
- Column Chart showing Fund Sources Payroll Costs.
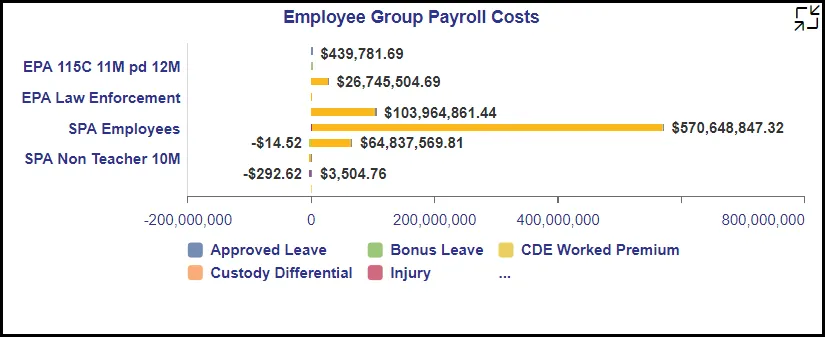
- Bar Chart showing Employee Group Payroll Costs by Wage Type Group.
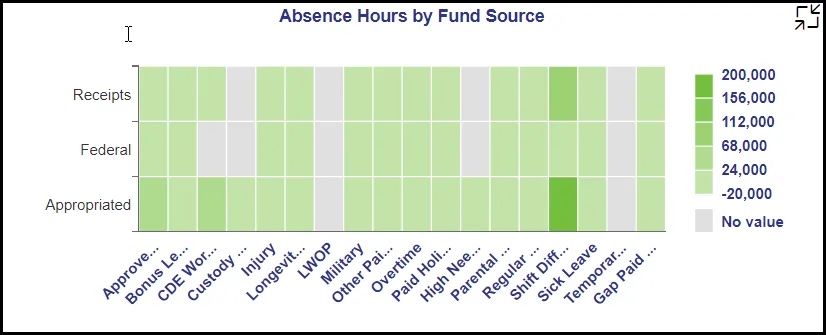
- Heat Map Chart showing Absence Hours by Fund Sources.
Note:
Many charts do have an icon in the upper right corner to enable expansion of the chart to see a full-screen view.
- Detailed view icon on ‘Payroll Costs by Fund Sources’ spreadsheet will show a full screen view of the same metrics for the last twelve months starting with the Calendar Month/Year selected in the Prompt Input.
- Detailed view icon on ‘Fund Sources Payroll Costs’ chart will show a full screen view of a Heat Map chart with the title ‘Funding Sources Payroll Actuals for Single Month‘ shows various wage type group Payroll Costs by Fund Sources.
- Detailed view icon on ‘Employee Group Payroll Costs’ chart will show a full screen view of a Heat Map chart with the title ‘Employee Group Payroll Actuals for Single Month‘ shows various wage type group Payroll Costs by Employee Groups.
- Detailed view icon on ‘Absence Hours by Fund Source’ Heat Map chart will show a full screen view of the same metrics in detailed.
Countywise Tab
Below is a sample of the dashboard charts under the Countywise tab.
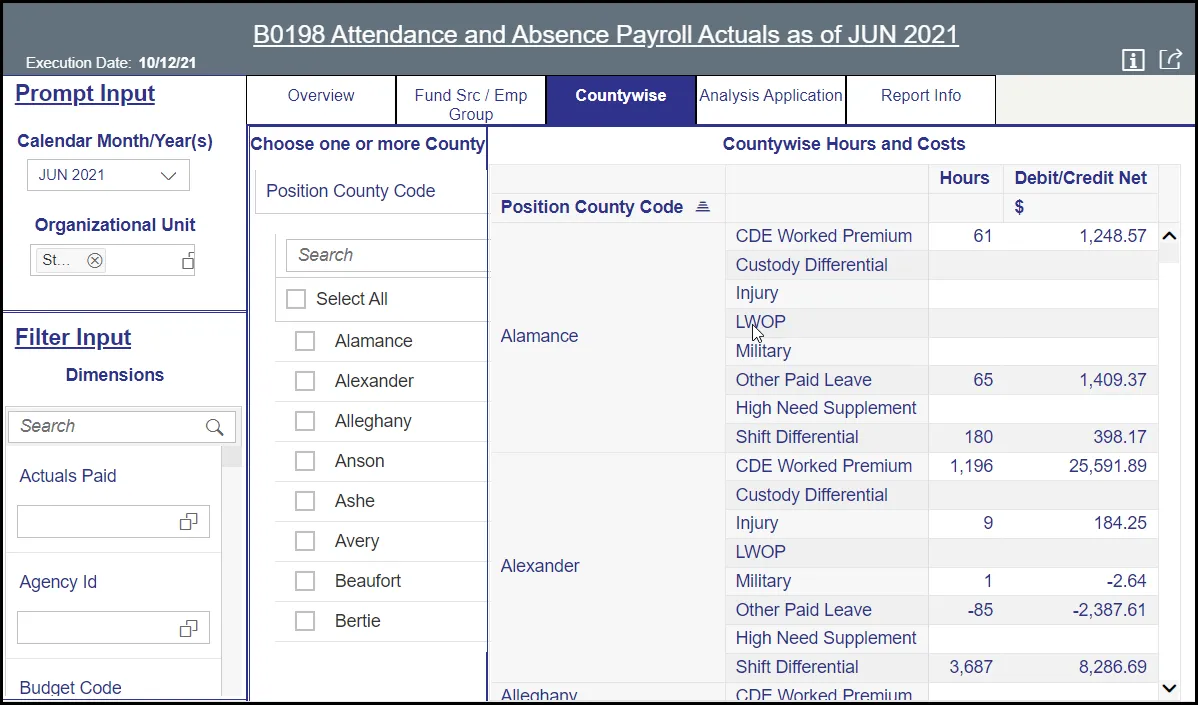
There are two data components displayed in this tab.
- Dimension Filter component, which is a multi-select check box component, showing Position County Codes.
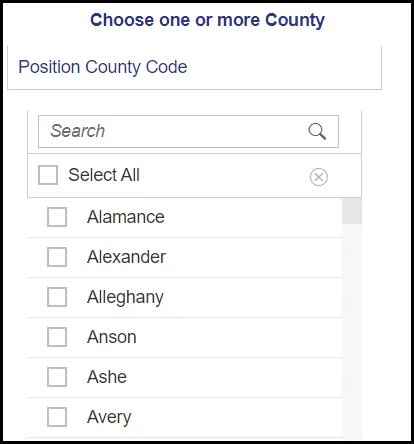
Note: Selecting a County Code in this control applies to ALL data across ALL tabs viz Overview, Fund Src/Emp Group, Countywise, and Analysis Application.
- A Crosstab component showing Countywise Hours and Costs of different Wage Type Groups.
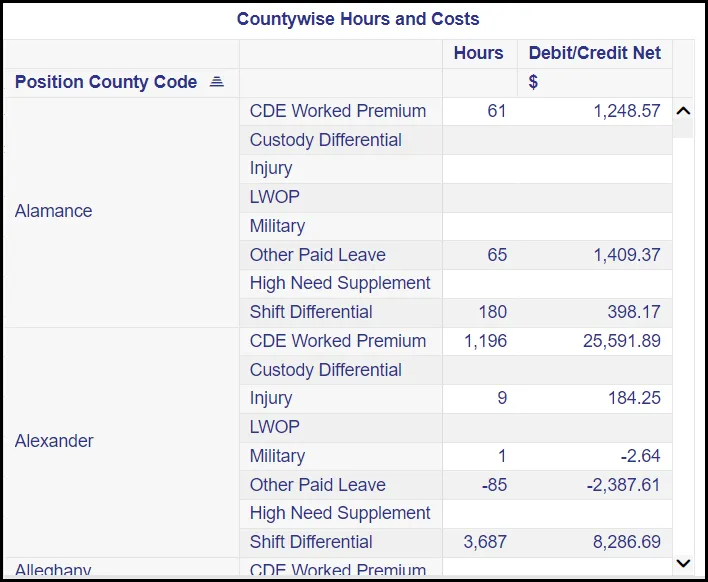
Note:
- Initial view will show the above 8 wage type groups for each county. However, if any change to filter input dimension ‘Actuals Paid’ occurs in the document, this Crosstab component will show full complete list of all the wage type groups defined in the backend system.
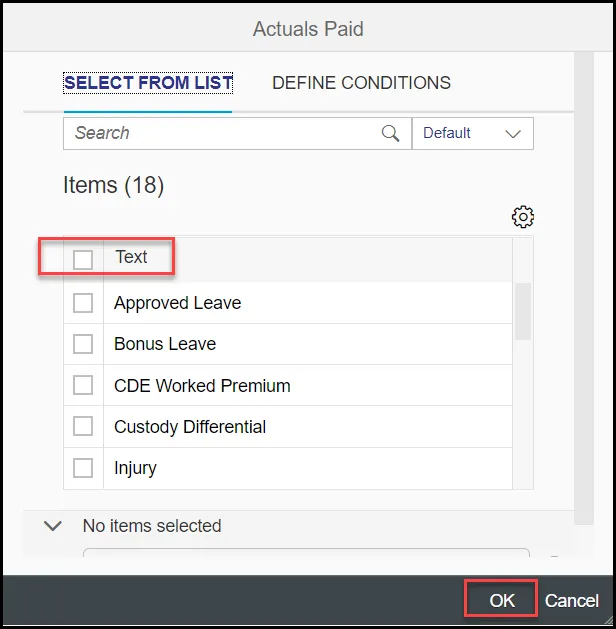
- How to see all Wage Type Groups for the counties?
Hint: Choose filter input dimension ‘Actuals Paid’ from the left panel and press OK. Deselect all ‘Text’ checkbox also functions like select all.
Analysis Application Tab
The Analysis Application tab is an interactive interface to manipulate the data table on the workspace to customize this data view.
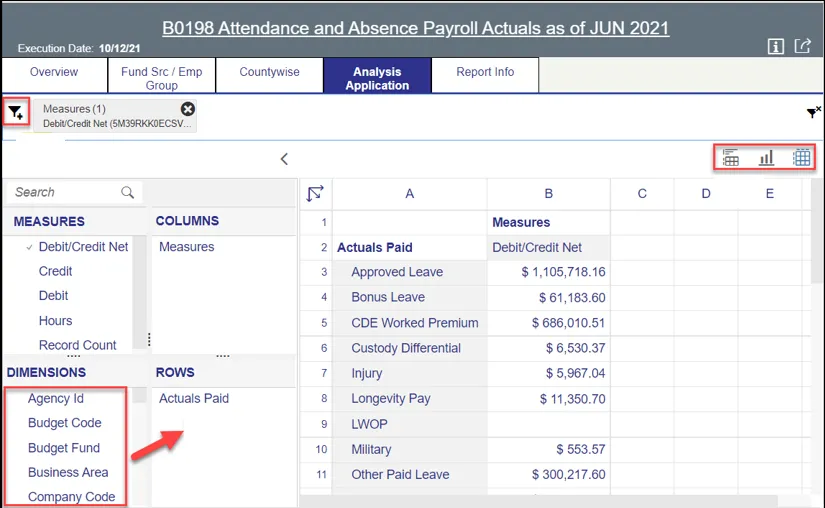
- Dimensions can be dragged into the ‘ROWS’ area to customize the data table.
- The funnel icon can be used to apply additional dimension filters to the data set.
Note: Applying filters in this tab will affect the data on all other tabs (Overview, Fund Src/Emp Group and Countywise). - Upper right corner has controls to enable switching your data view to a different type of chart or table.
Additional Standard Controls
The upper right corner contains two standard controls available.

- The Info icon displays information about the dashboard.
- The Export icon allows exporting to various formats.
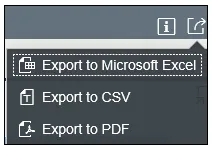
- Export to PDF will export images from the current active tab.
Special Report Considerations/Features
- Temporary employees are included.
Note: To exclude Temp Employees, Filter Input panel filters on Employee Group dimension values ‘O’ and ‘X’ can be used, and filter on Employee Subgroup dimension to exclude specific employee subgroups. - Sometime the X-axis Y-axis texts are shortened and may not show the full text due to space. Hovering the Mouse over the text will show the full text.
- The following Accrued Vacation and Accrued Comp Time GL Accounts are excluded from the report: 21121001, 21121002, 50170000, 50170100, 51211200, 51211210.
- Wage Type Group listing is referred to as ‘Actuals Paid’ in this report, and this list is maintained manually in the backend system. Changes to the Integrated HR-Payroll System Payroll Wage Types addition or deletion are to be handled manually in the BI backend system in Bex query to see its effects in this report. A complete list of Actuals Paid - Wage Type Group is listed in this document (see below).
- NCFS Accounting Segments - are available for reporting in this report as drag and drop from Available Objects.
- NCFS accounting segments here are specific to an NCFS internal order in SAP HR/Payroll ERP system. Transactions with no NCFS internal orders will not display values for the NCFS segments in the BI BOBJ report.
- NCFS Agency, NCFS Agency Program, NCFS AMU, NCFS Budget Code, NCFS Budget Fund, NCFS Funding Source, NCFS Interfund, NCFS Project, NCFS User Define 1, NCFS User Define 2, NCFS User Define 3
- Agencies (like NCDOT, DES and DWS) that do not use NCFS Internal Orders will not see the values for the above NCFS segments in reports.
- NCFS Account and Budget Funding Source (OSBM) are available for reporting. Values correspond to SAP GL Account and Funding Source in SAP HR Payroll system.
- Financial Key is representative of internal order from NCFS and old NCAS systems.
- NCFS accounting segments here are specific to an NCFS internal order in SAP HR/Payroll ERP system. Transactions with no NCFS internal orders will not display values for the NCFS segments in the BI BOBJ report.
Actuals Paid – Wage Type Group Listing
| Wage Type Group | Wage Type(s) |
|---|---|
| Approved Leave | 1306;1327;1343;1358;1331;1344;1323;1360;1340;1301;1330;1326 |
| Bonus Leave | 1304;1356;1361;1363;1364 |
| CDE Worked Premium | 1383 |
| Custody Differential | 1261;1263 |
| Injury | 1319;1329 |
| Longevity Pay | 1220;1230 |
| LWOP | 1311 |
| Military | 1320;1321 |
| Other Paid Leave | 1312;1313;1314;1315;1316;1317;1318;1339;1366;1373;1374;1375;1376;1377;1378;1379;1381;1382;1386;1388;1389;1390;1392;1394;1395; 1397 |
| Overtime | 1210;1211;1212 |
| Paid Holiday | 1240;1325;1342 |
| High Need Supplement | 1430;1431;1432;1433 |
| Parental | 1370;1371 |
| Regular Salary | 1000;1100;1150;1155;1160;1175;1200 |
| Shift Differential | 1250;1251;1252;1253;1254;1255;1256;1380;1385 |
| Sick | 1302;1341 |
| Temporary Hours | 1201;1202;1203;1204;1205;1264 |
| Gap Paid | 1307;1350;1354 |
Note: Wage Types listed here with semicolon separated can be used directly in BOBJ Webi reports, say for example if the dollar amounts are to be verified with B0028 report. See the section below with the title ‘Comparing this dashboard with BOBJ WEBI report ‘B0028: Payroll Financial Postings Analysis’.
How to see ‘Key and Text’ in Prompt Input and Filter Input panels
There are 3 steps to complete this process.
Step 1: Choose Organization Prompt from Prompt Input panel.
Step 2: Choose on the icon at the far right.

Step 3: Choose Key and Text.
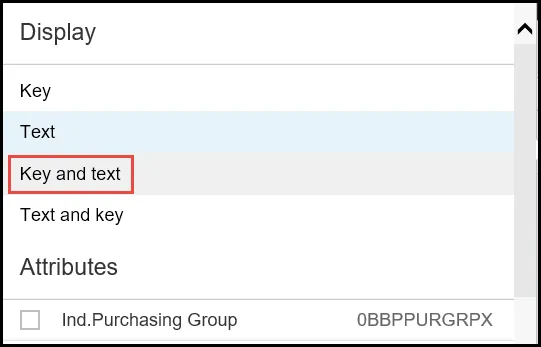
Note: Key and Text can be selected the same way in Filter Input panel dimensions too.
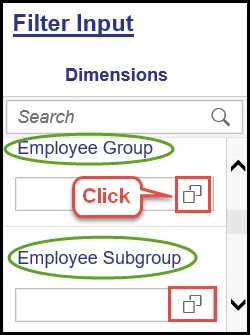
How to exclude Temporary Employees
There are 7 steps to complete this process.
Step 1: Choose Employee Group or Employee Subgroup filter dimension from Filter Input panel.
Step 2: Choose ‘Define Conditions’ Tab and then expand the ‘Exclude.’
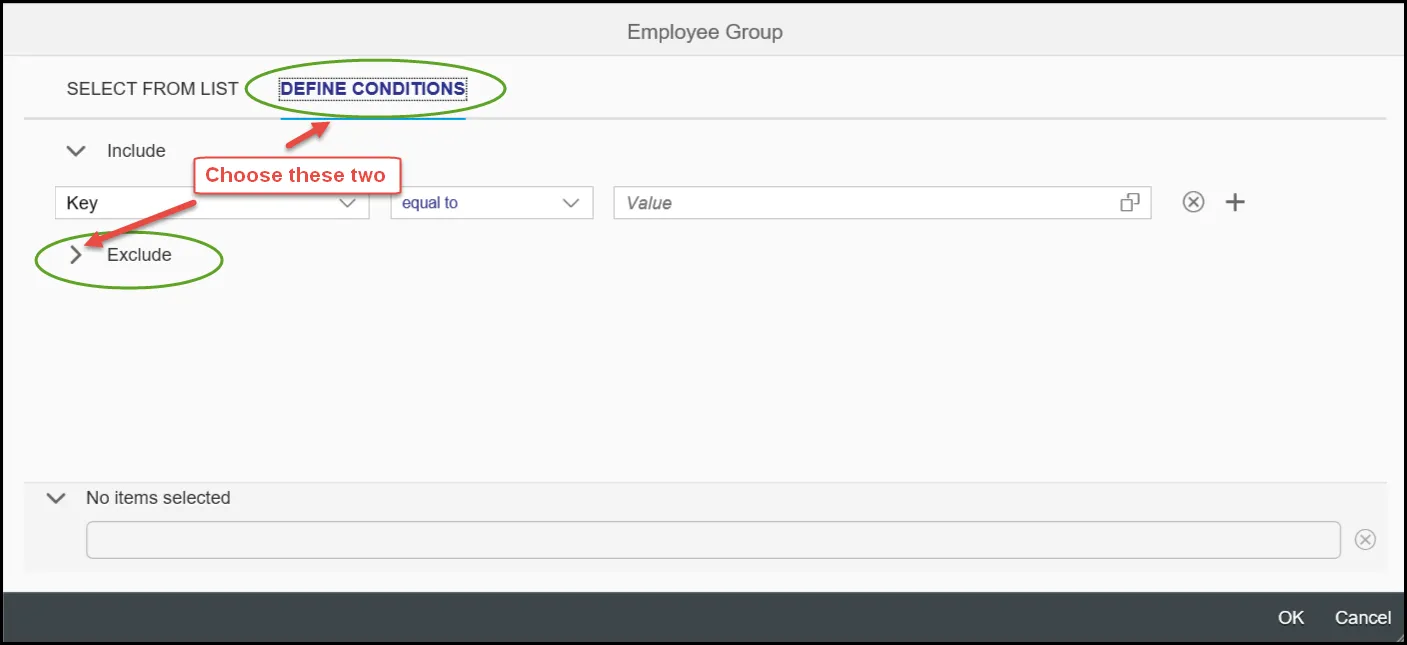
Step 3: Click on the icon in Value box.

Step 4: Choose ‘Supplemental Staff (O)’ and press OK.
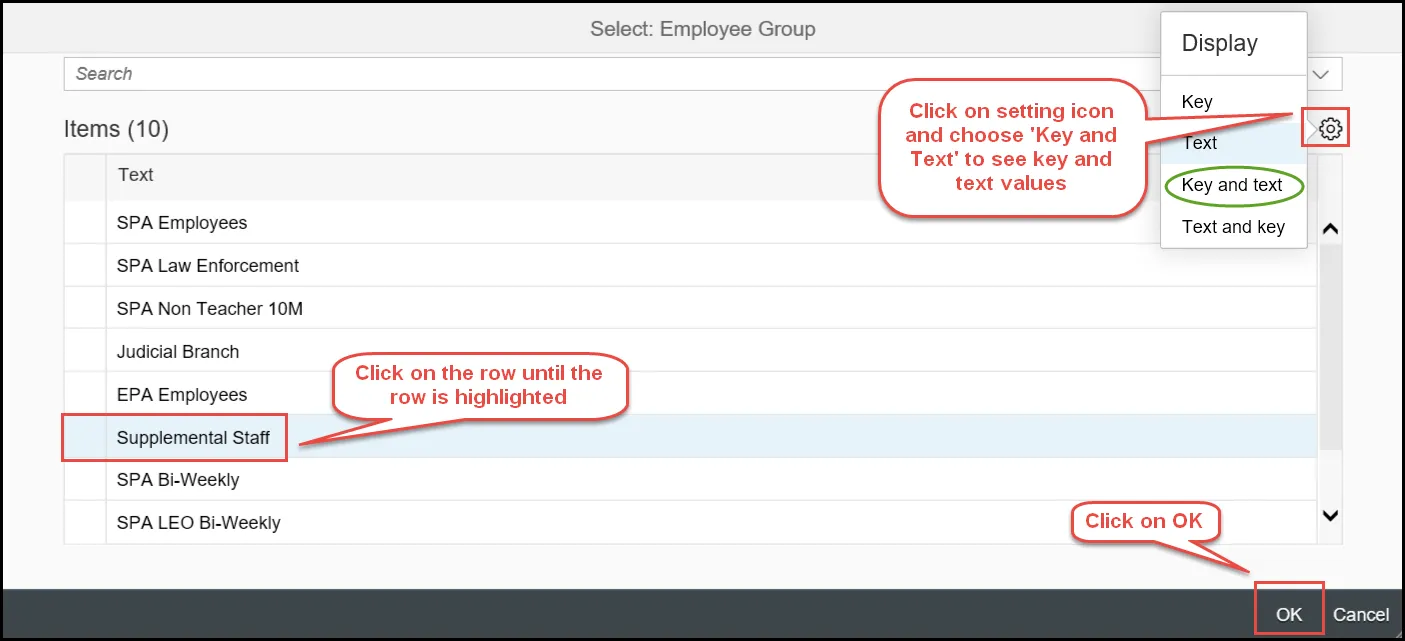
Step 5: To add more Exclude values like ‘Supplemental Staff Grant (X) ‘, choose the ‘+’ symbol at the end and add a row. Select another value from the selection list as the same way in step 4.

Step 6: Click on OK after the two required exclude values are selected.
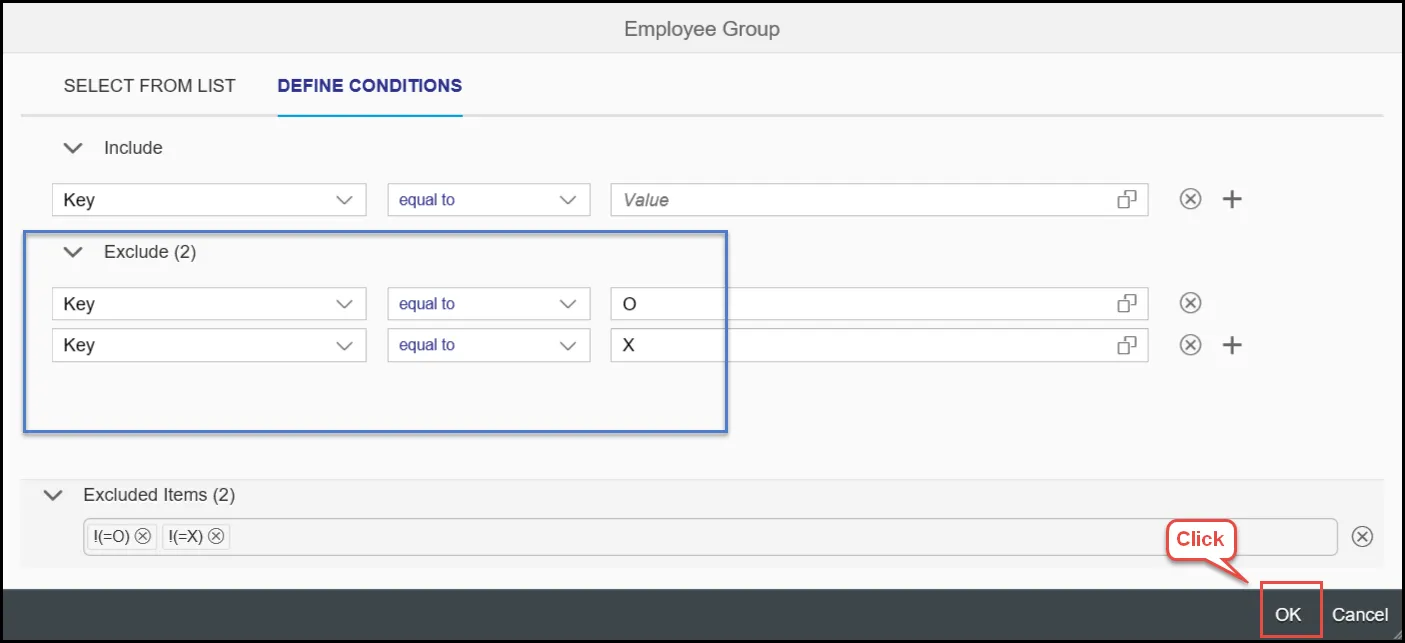
Step 7: The report will display after excluding the selected values.
Note: Employee Subgroups specific to Temp Employees also can be excluded in the same way.
Employee Groups
- O – Supplemental Staff
- X – Supplemental Staff Grant
Employee Subgroups
| 0E PT S-FLSAOT Temp MAG 15 FT N-FLSAOT Temp Dir 1E PT N-FLSAOT Temp Dir 25 FT N-FLSAOT Temp JB1 2E PT N-FLSAOT Temp JB1 35 FT N-FLSAOT Temp JB2 3E PT N-FLSAOT Temp JB2 45 FT N-FLSAOT Temp JB3 4E PT N-FLSAOT Temp JB3 55 FT N-FLSAOT Temp DA 5E PT N-FLSAOT Temp DA 65 FT N-FLSAOT Temp ADA 6E PT N-FLSAOT Temp ADA 75 FT N-FLSAOT Temp MAG 7E PT N-FLSAOT Temp MAG 85 FT S-FLSAOT Temp CR 8E PT S-FLSAOT Temp CR 95 FT N-FLSAOT Temp CSC 9E PT N-FLSAOT Temp CSC Q5 FT N-FLSAOT Temp SC QE PT N-FLSAOT Temp SC S5 FT N-FLSAOT Temp CJP SE PT N-FLSAOT Temp CJP SI FT N-FLSAOT Temp ACJP SL PT N-FLSAOT Temp ACJP SO FT S-FLSAOT Temp ACJP SR PT S-FLSAOT Temp ACJP T5 FT N-FLSAOT Temp AD TE PT N-FLSAOT Temp AD U5 FT N-FLSAOT Temp JBS UE PT N-FLSAOT Temp JBS V5 FT S-FLSAOT Temp JBS VE PT S-FLSAOT Temp JBS A6 FT N-FLSAOT Student A7 FT N-FLSAOT Intermit B6 FT S-FLSAOT Student B7 FT S-FLSAOT Intermit G7 Temp FT N-FLSAOT G8 Temp FT S-FLSAOT GA Temp PT N-FLSAOT GB Temp PT S-FLSAOT GC Temp Sol FT N-FLSAOT GC Temp Sol FT N-FLSAOT GD Temp Sol FT S-FLSAOT GE Temp Sol PT N-FLSAOT GF Temp Sol PT S-FLSAOT WF PT N-FLSAOT Student WG PT N-FLSAOT Intermit Y6 PT S-FLSAOT Student Y7 PT S-FLSAOT Intermit G1 Contractor G3 Volunteer G4 Board Member G5 National Guard G6 Federal |
How to see Heat Map chart cell content values that display blank?
Sometimes the Heat Map chart shows a blank cell value shaded with light green to dark green colors. Main reason for this is the cell values are larger than the size of the cell and too many data elements in the dashboard chart.

To see the cell values, follow the steps below. There are 2 steps to complete this process.
Step 1: Open the detailed view of the map by clicking on the top right corner open button inside the chart.
Step 2: The full screen detailed view will show most of the cell contents. If still some green colored cell values are not shown, then keep reducing browser zoom level until you see all values in small font.
Hint:
- Hold the CTRL key in keyboard and keep scrolling the mouse roller down or use browser Zoom page level setting (- minus) to reduce the font size.
- If Regular Salary or any other wage type group has a huge content value in the cell and makes the chart fonts too small, then temporarily remove ‘Regular Salary’ using the Filter Input Dimension ‘Actuals Paid’ and see if the view is better. You can reset the Actuals Paid filter input dimension later by using Select All check box inside the filter. (Refer the section below ‘How to simplify the initial chart view’.
How to simplify the initial chart view
Answer: By reducing the wage type groups after unchecking few in ‘Actuals Paid’ Filter Input dimension filter.
The initial view of a few charts in this report looks convoluted and failed to display the metrics in full detail, this may be due to too many Wage Type Groups being projected in a small window.
Users can adjust the number of Wage Type groups displayed in charts using the Filter Input Dimension ‘Actuals Paid’ from the left side panel.
Sample use case to remove ‘Regular Salary’ from chart view. There are 3 steps to complete this process.
Step 1: Choose the ‘Actuals Paid’ Filter Input dimension on the left side panel and click on the help for values icon on the right.
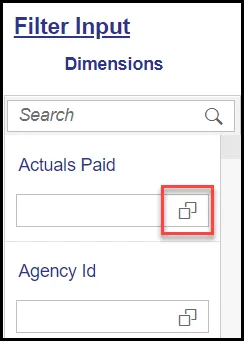
Step 2: Click and select the top-level check box to select all the values.
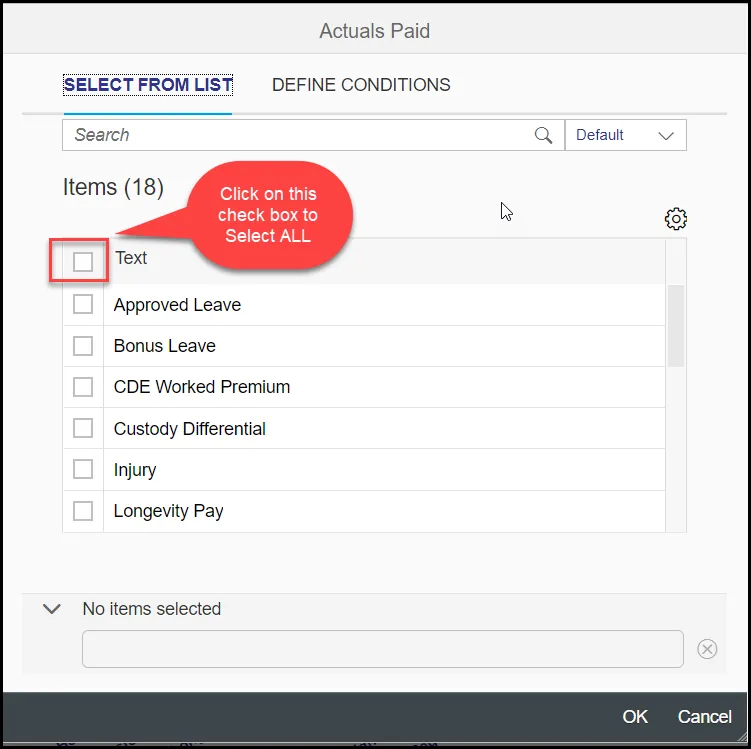
Notice all the values are selected after the Text checkbox is checked.
Step 3: Scroll down inside the box to find Regular Salary and uncheck the checkbox of Regular Salary.
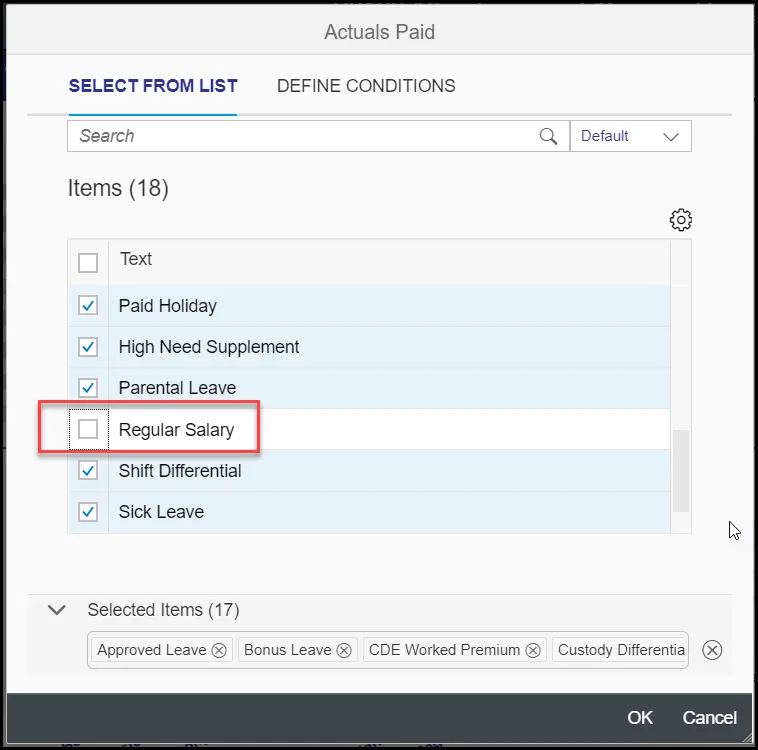
Step 4: Click on OK to continue.
Comparing this dashboard with BOBJ WEBI report ‘B0028: Payroll Financial Postings Analysis’
Note: Agency users must have authorization to run B0028 in HR-Payroll (Beacon) to see this comparison.
BI Payroll data provider is the data source for this dashboard report and B0028: Payroll Financial Postings Analysis report. However, both reports function in slightly different ways as B0028 report is designed to run based on a specific Business Area, whereas this dashboard report is designed to run for users who have authorization access to their specific OrgUnits. Hence the direct comparison of B0198 with B0028 is not apple-to-apple.
Having said that, still payroll expenditures associated with specific OrgUnits can be validated and compared in both reports. To get to the level of details to match, run both reports based on the following criteria:
- Business Area
- Calendar Month/Year
- Organization Unit(s)
- Wage Type Groups (Actuals Paid)
Note: Both reports will match only if all the above 4 criteria are met.
A sample use case to validate ‘Injury Leave’ payroll actuals in both the reports:
There are 5 steps to complete this process.
Step 1: Run this dashboard report B0198 from ‘PT: Quota Payouts’ folder.
Step 2: Report runs with the following default values for the following two Prompt Input data elements.
- Organization Unit(s) - the user has authorization to see.
Hint: Note all the Organization Units listed and enter the same in B0028 during execution.
- Calendar Month/Year – default is Current calendar month/year.
Step 3: Fill the following Filter Input Dimension:
- Business Area
Hint: Note Business Area selected here and enter the same in B0028 during execution.
- Wage Type(s): 1319;1329 (Injury)
- OR choose ‘Actuals Paid’ dimension filter and select ‘Injury’ from the list of values.
Step 4: Run BOBJ Webi report B0028 from HR-Payroll folder ‘FI: Payroll Financial Posting Analysis’.
Step 5: Fill the following prompts in B0028 exactly matching the same way B0198 was run:
- Business Area
- Calendar Month/Year
- Organization Unit(s)
- Wage Type(s): 1319;1329 (Injury)
Note: All these 4 prompt values in B0028 must match with B0198 Prompt Input and Filter Input Dimension values of the same data elements.