Purpose
The purpose of this report is to explain how to generate the B0192 Employee Generational Diversity Summary report.
Report Description
The B0192: Employee Generational Diversity Summary dashboard displays the number of employees by generational diversity categories for employees’ subject to and exempt from the State Personnel Act. The headcounts and their percentages are over a single month’s time-period. This report provides employee headcount by generational diversity which includes All Generations, Matures, Baby Boomers, Generation X, Millennials and Generation Z.
Report Location
PA: Employee Headcount
Report Uses
• This report can be used to analyze the number and percentage of active employees within each social generation.
• Social generations are cohorts of people born in the same date range and who share similar cultural experiences.
Date Load Frequency
The headcount data being shown for this report is loaded every weekday morning, excluding holidays. A snapshot of the previous month’s headcount data is created on the first day of every month and the snapshot data will not be subject to any retro activity actions.
How to Generate This Report
This dashboard loads with your highest level of access from your Organizational Unit and the Current Calendar Month.
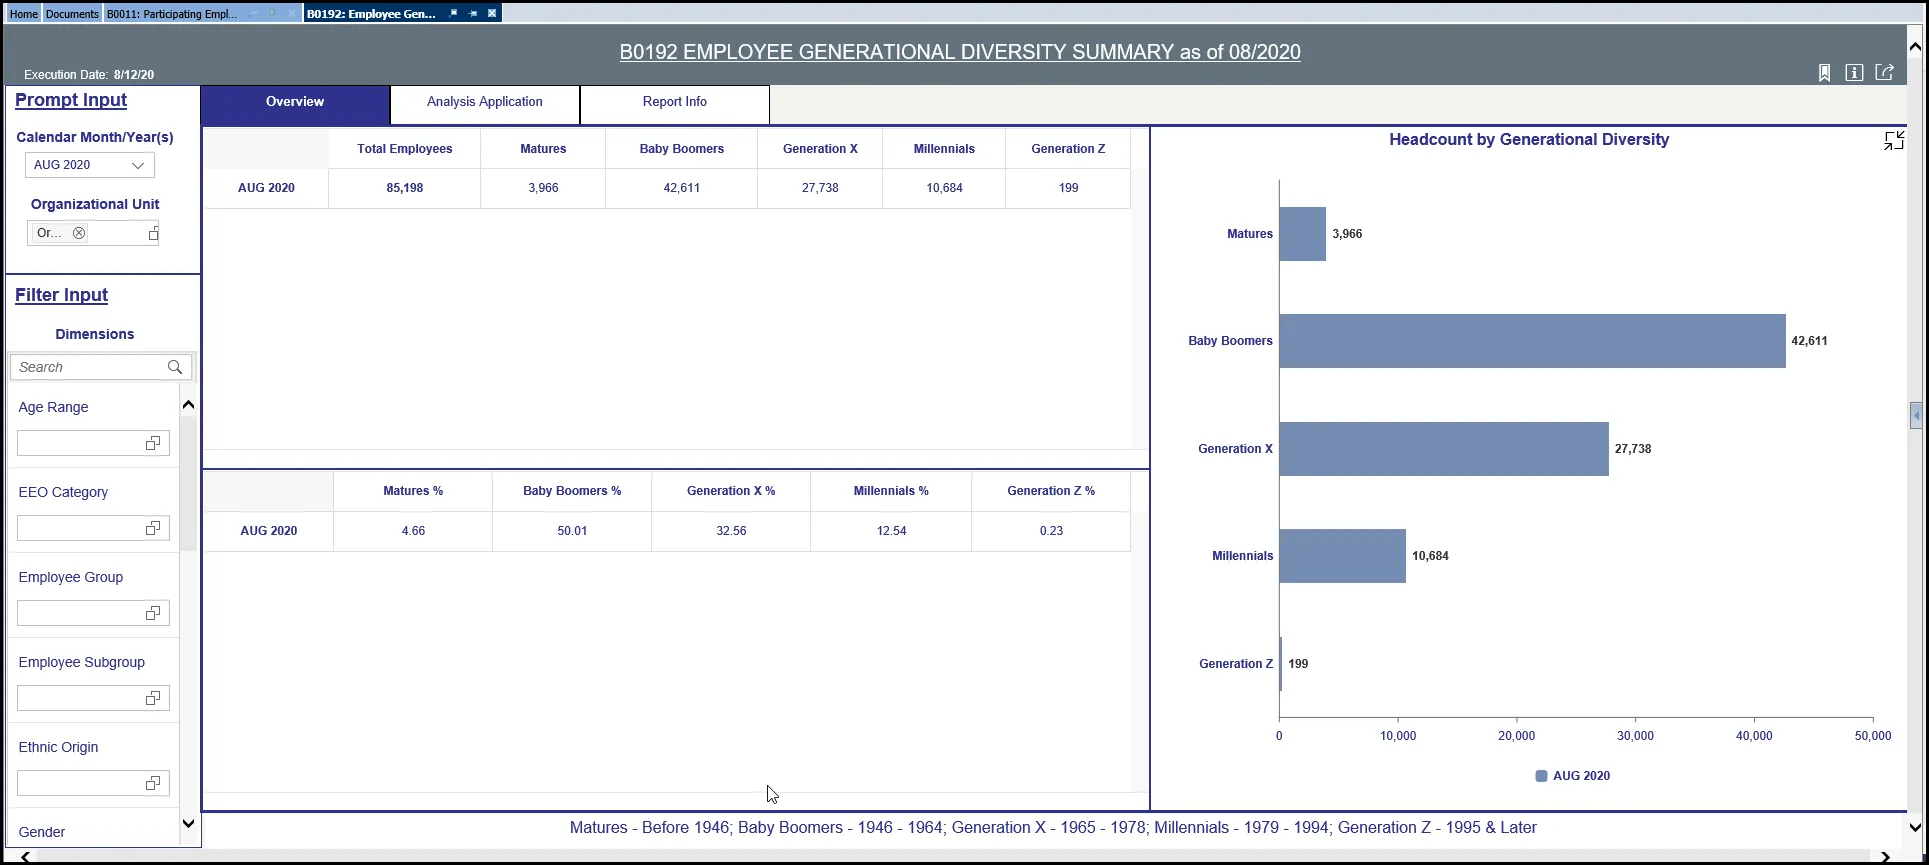
Initial Layout
Below is a sample of the initial layout rendered.
Employee Generational Diversity (1st tab): This tab displays the Employee Generational Diversity data based on the selected prompt values.
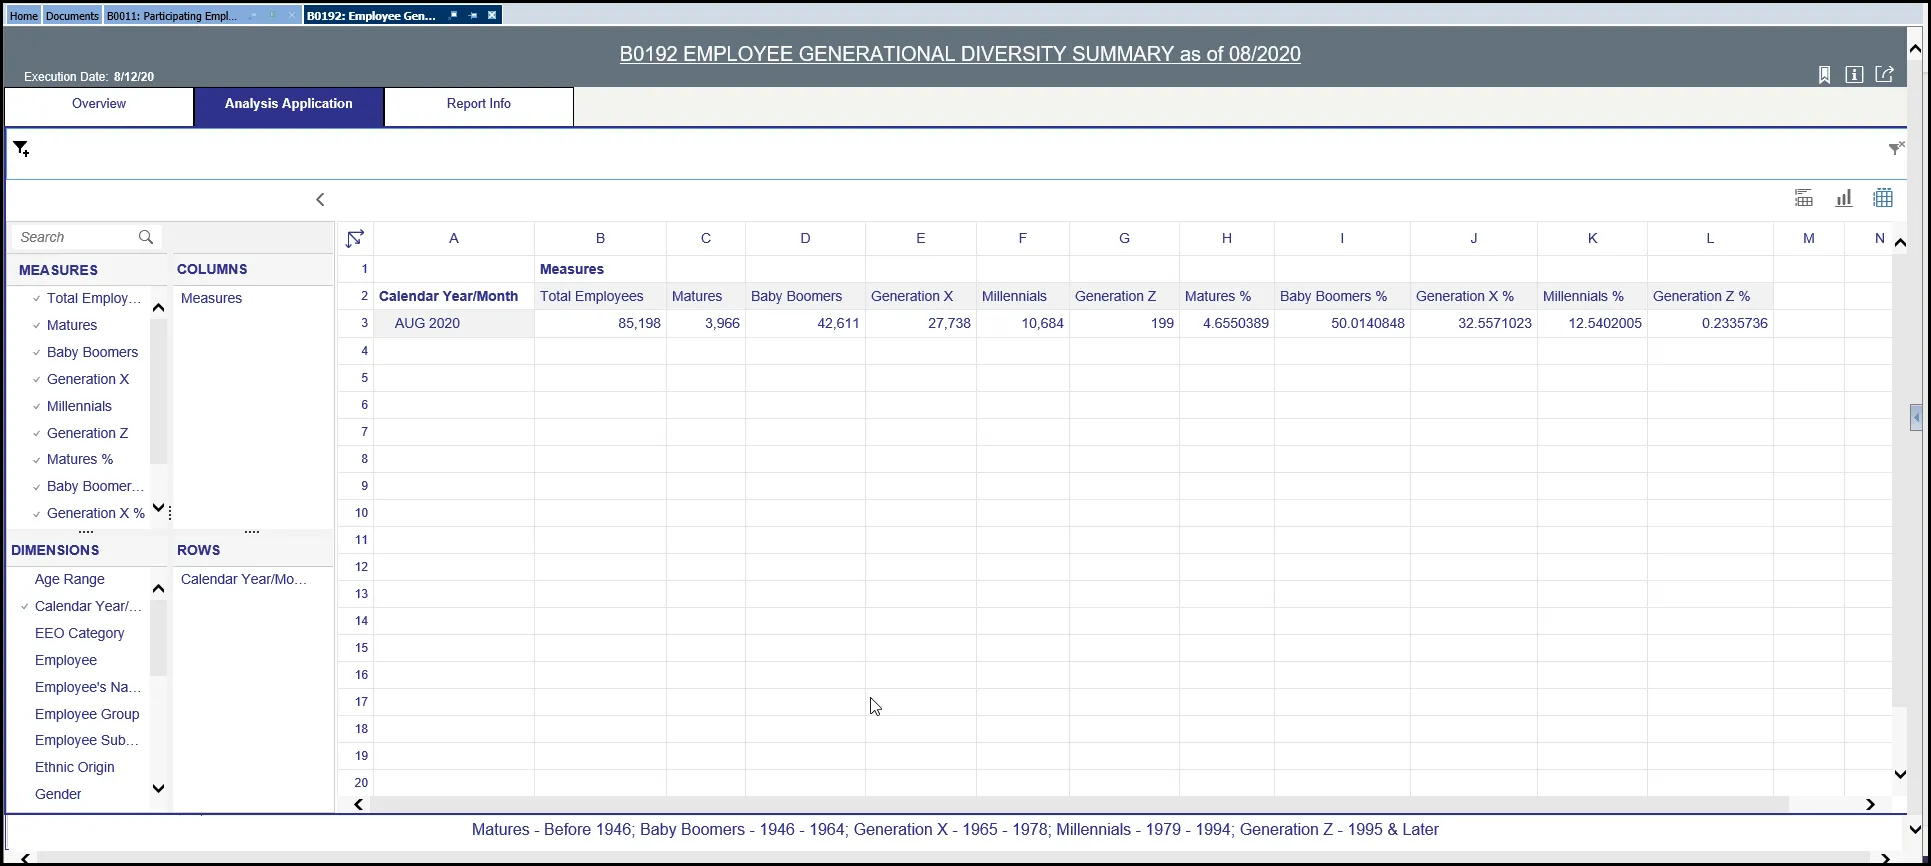
Analysis Application (2nd tab): Allows users to create their queries and display the results.
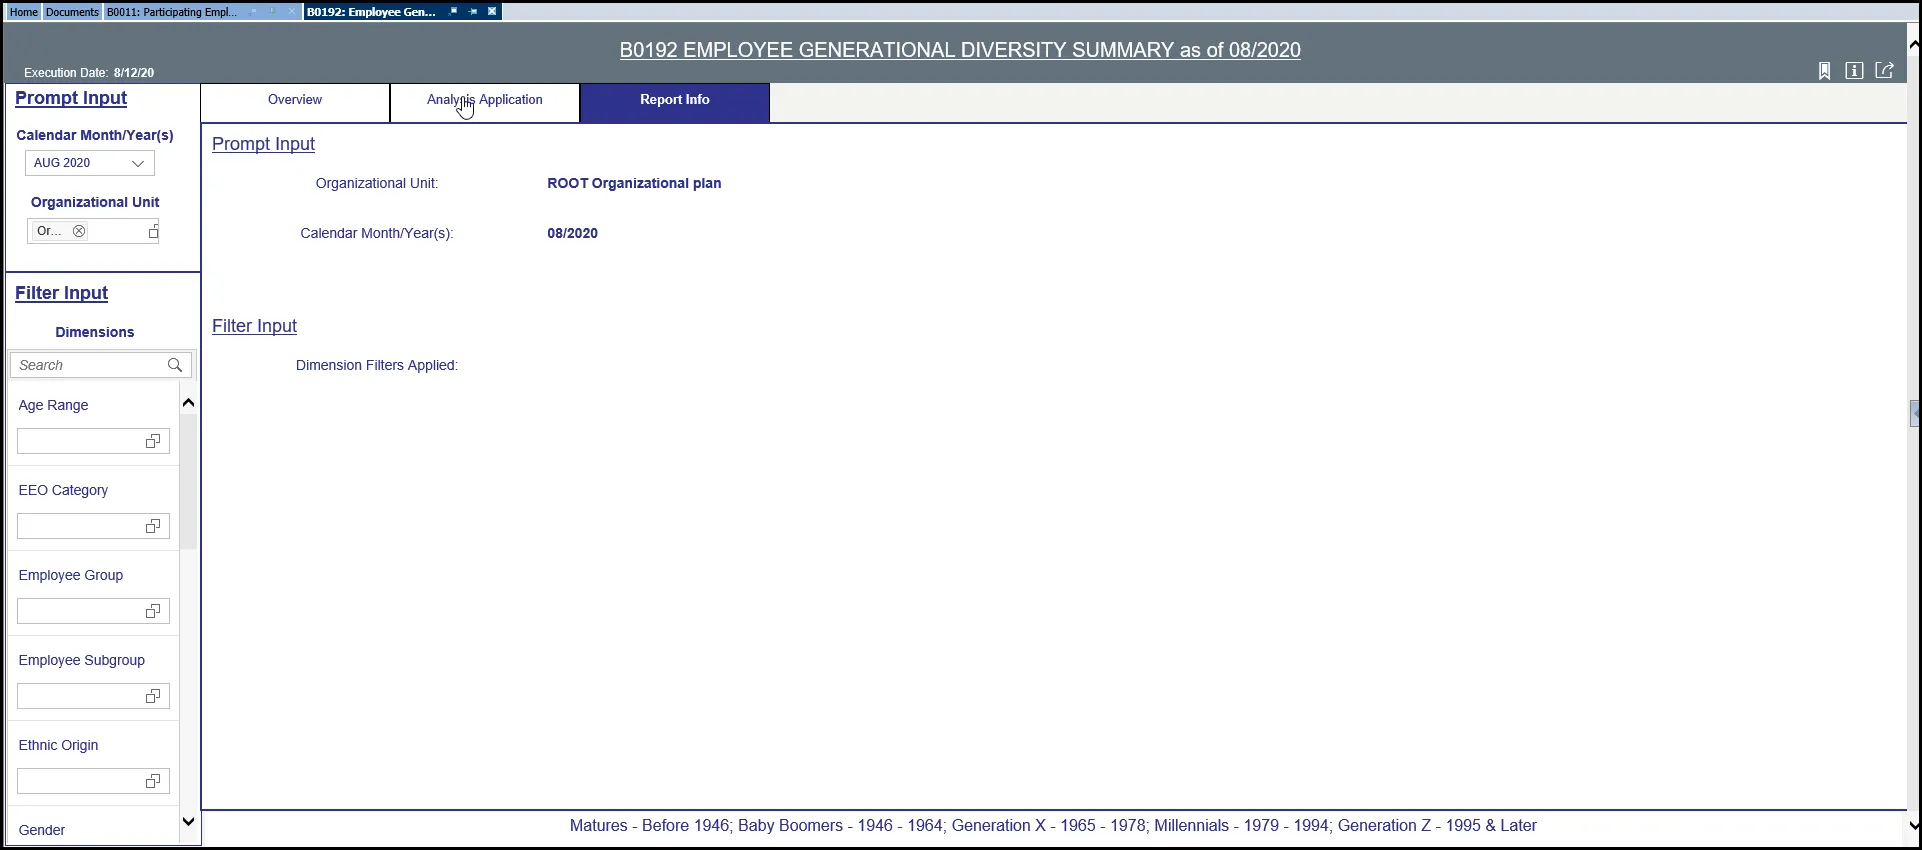
Report Info (3rd tab): This tab lists all prompt values selected. The filter input will not show your choices because of spacing issues but will note Dimension filters applied.
Special Report Considerations/Features
- This dashboard report is developed using SAP Lumira application.
- The Crosstab tables represent the number of employees and percentage total of Employee Diversity by the groupings Matures (born before 1946), Baby Boomers (1946 – 1964), Generation X (1965 – 1978), Millennials (1979 – 1994) and Generation Z (1995 and later). The Bar chart represents the number of employees by social generation.
- Employee Subgroup G1 – Contractors and G5 – National Guards are excluded from the report.
- Employment Status - Report runs for Active Employees only.
- PMIS data is available for reporting from 2008 onwards.
- This dashboard report can be refreshed, exported and printed.
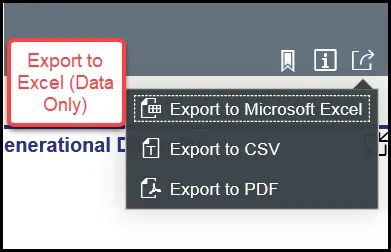
- The Export to Excel (Data Only) button exports only the crosstab query data.
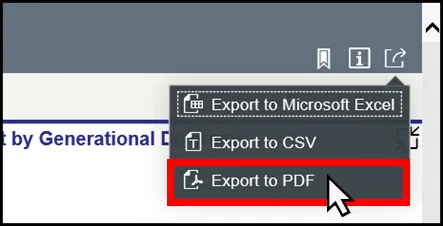
- The Export PDF button exports the report to PDF format. The first page of the PDF report contains the entire layout of the dashboard. Each additional page is the enlarged version of each crosstab or bar chart. The final two pages are the Analysis Application and the Report Info.
How to refresh the report
The dashboard report can be refreshed whenever you make a change to the Prompt Input or the Filter Input. By making changes in either of the Prompts which would include the Organizational Unit or the Calendar Month/year will refresh the entire dashboard. Also, making changes to any of the Dimensions within the Filter Input will refresh the dashboard.
How to Export to Excel
The “Export to Microsoft Excel (Data Only)” option exports only the data. Charts are exported through Export to PDF. There are 2 steps to complete this process.
Step 1: Click the Export to Microsoft Excel (Data Only) icon.
Step 2: The Microsoft Excel download popup window will appear as below:
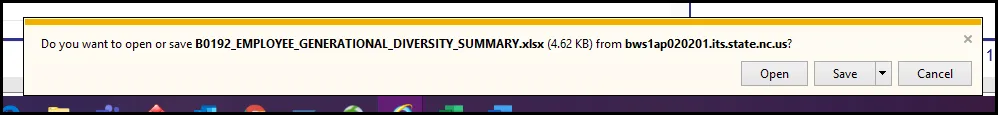
Note: If this popup window doesn’t appear, check your Excel download settings of your Microsoft product.
How to Export to PDF
The Export to PDF option exports the entire dashboard into your chosen browser. There are 2 steps to complete this process.
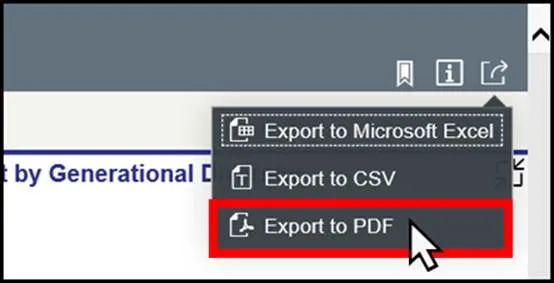
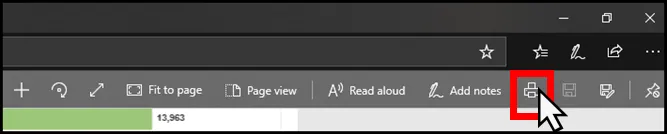
Step 1: Click the Export to PDF icon.
Step 2: The Microsoft download popup window will appear as below:
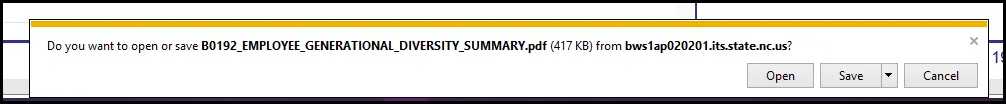
Note: If this popup window doesn’t appear, check your Adobe PDF download settings of your Adobe product.
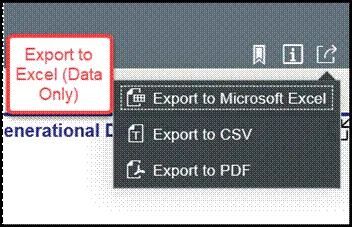
How to Export to CSV
The Export to CSV option exports only the data. Charts are exported through Export to PDF. There are 2 steps to complete this process.
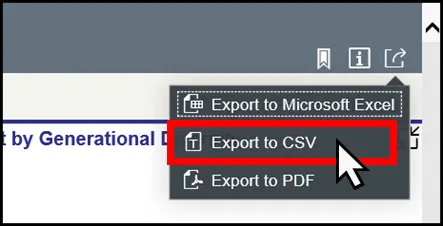
Step 1: Click the Export to CSV icon.
Step 2: The Microsoft download popup window will appear as below:

If this popup window doesn’t appear, check your Adobe PDF download settings of your Adobe product.
How to get information about dashboard
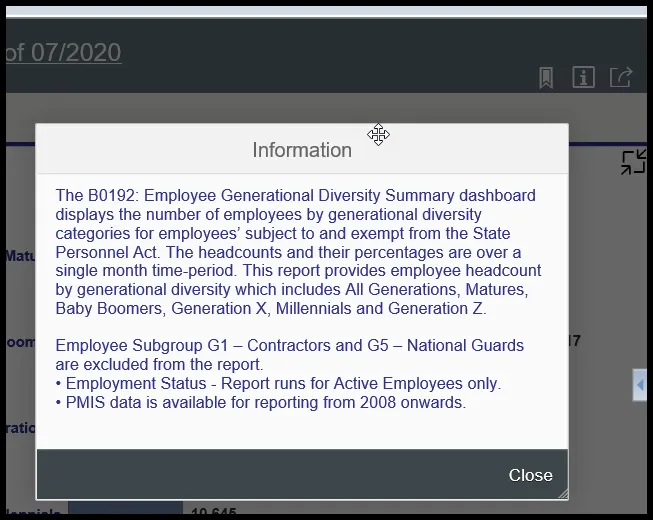
Click on the Information (i) icon to get information on the dashboard which provides a quick reference guide for the report. It also provides what data is excluded from the dashboard.
How to Create a Bookmark
You can save your queries that you have created within the dashboard. There are 4 steps to complete this process.
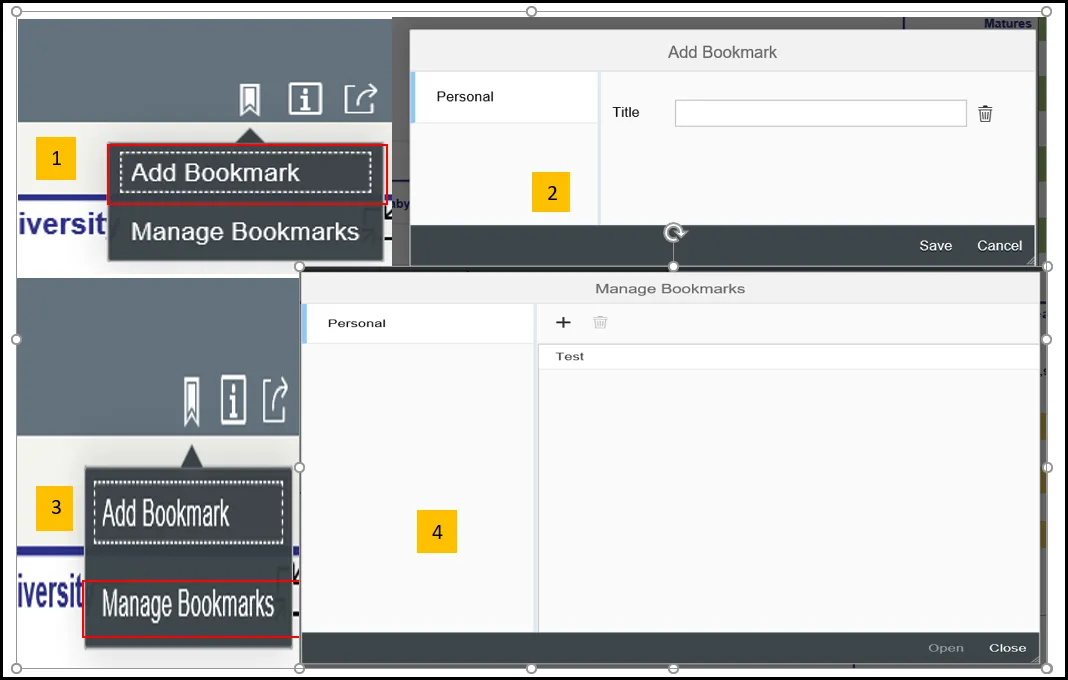
Step 1: Click on the Bookmark Icon and choose Add Bookmark.
Step 2: Create a name for your query.
Step 3: If you want to open the bookmark, click the Bookmark icon again and choose Manage Bookmarks.
Step 4: Click on the name of the bookmark and it will open the query /dashboard that was saved.
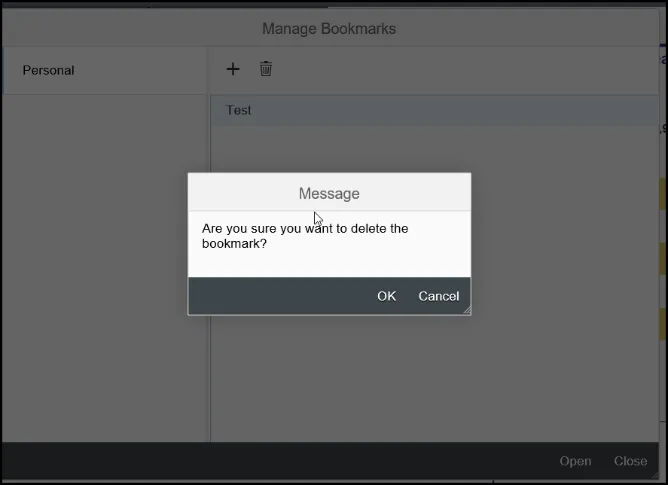
Note: If the bookmark is no longer needed you can delete it by highlighting the title and clicking the trashcan.
How to Print
The user will need to print from the exported PDF version of the dashboard. The Print option is the regular browser print. User may have to adjust the printing preferences to suit their printer settings.
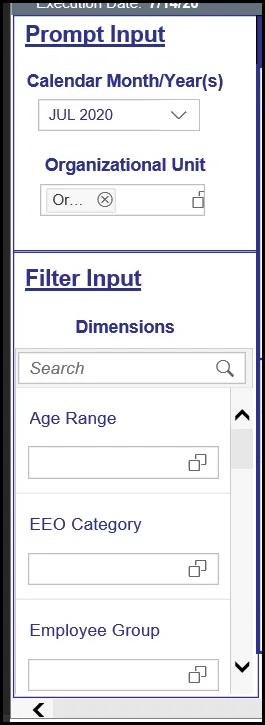
How to Directly Enter the Prompt Values
Prompt values can be entered manually. There are 3 steps to complete this process.
Step 1: Click on either the words ‘Organizational Unit’ or “Calendar Month/Year”.
Step 2: For the Calendar Month/Year choose from the dropdown which month/year combo you want to see data. For the Organizational Unit, expand the search window the dashboard opens with the highest level of access, you will only be able to drill down further if you have other access.
Step 3: Click OK.
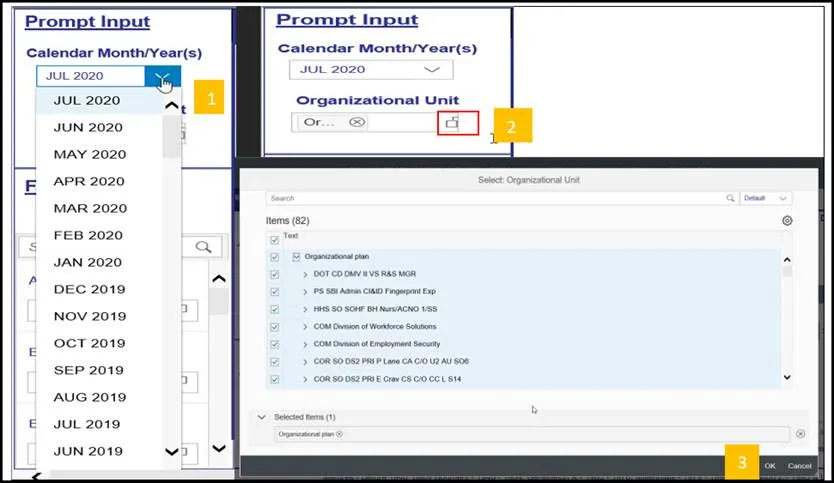
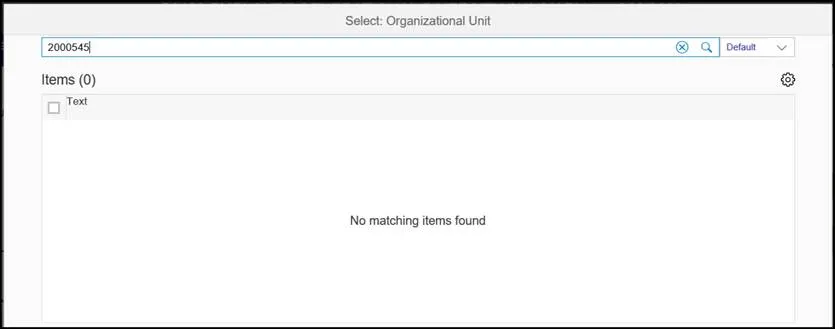
Note: When incorrect prompt values are entered manually, the prompt is highlighted in RED.
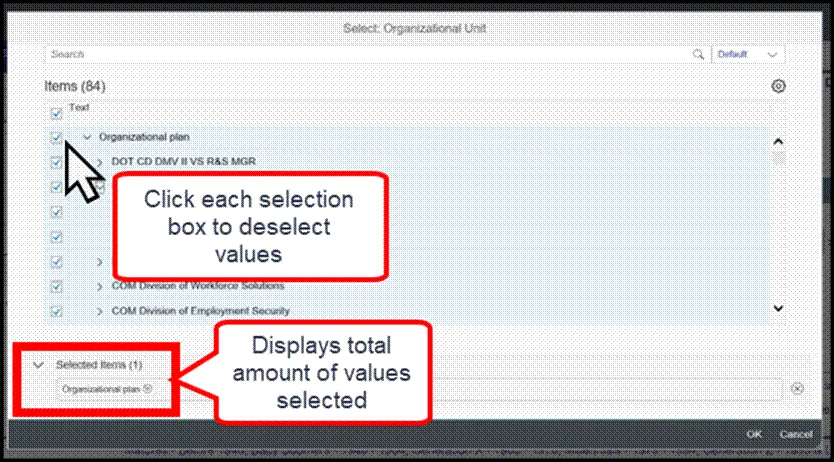
How to Deselect the Organizational Units from the Prompts
There are many ways to deselect the Organizational Units. There are 3 options.
Option 1: User can individually deselect the Org Units manually they have access to.
Option 2: Click on the double tick mark icon twice to select and deselect. This will not remove the manually entered values.
Option 3: Click on ‘Selected Items’ which will show all the items selected or entered. Remove the selections from this window by clicking on the x in the far right of the screen.