Purpose
The purpose of this report is to describe and explain how to generate the Turnover Analysis report in the Integrated HR-Payroll System.
Report Description
This dashboard is based on data from the last 12 months (including current month) and displays separation metrics for employees who have left state government and employee transfers both external and internal. Metrics included are:
- Total Turnover Rate
- Separations by Action Type
- Separations by Calendar Month
- Separations by Educational Level
- Separations by Age Range
- Separations by Gender
- Separations by Ethnicity
- Separations by Length of Service
- Separations by Job Family
- Separations by Salary Range
- Separations by Involuntary/Voluntary/Retirement Categories
Report Location
PA: Turnover
Report Uses
Analyze Separation metrics and transfers to spot potential problem areas and assist in determining a course of action to help with employee retention.
For example:
- Is there a staffing risk due to a large number of Retirements?
- Is there a retention issue due to Salary Ranges?
- How long are employees staying in State government before leaving?
- Are there particular types of jobs that are more prone to having a higher turnover rate?
How to Generate This Report
There are no prompts required to generate this dashboard. Click on the dashboard report name “B0043: Turnover Analysis” in the PA: Turnover folder, and the report will execute.
The dashboard is generated with several summary charts in Overview tab showing metrics for Total Turnover, Separations by Category, Separations by Action Type and Separations by Calendar Month. Users can view the metrics for Demographic and Position Characteristics tabs that can be switched back and forth. Separation and Transfer metrics by County can be seen in map in the Location tab. The Location tab rendering is slow due to technical issues and may take a little over five minutes sometimes to show the data by county in a map.
The initial rendering defaults to showing all metrics specific to the agency OrgUnits to which the user has access.
Overview Tab
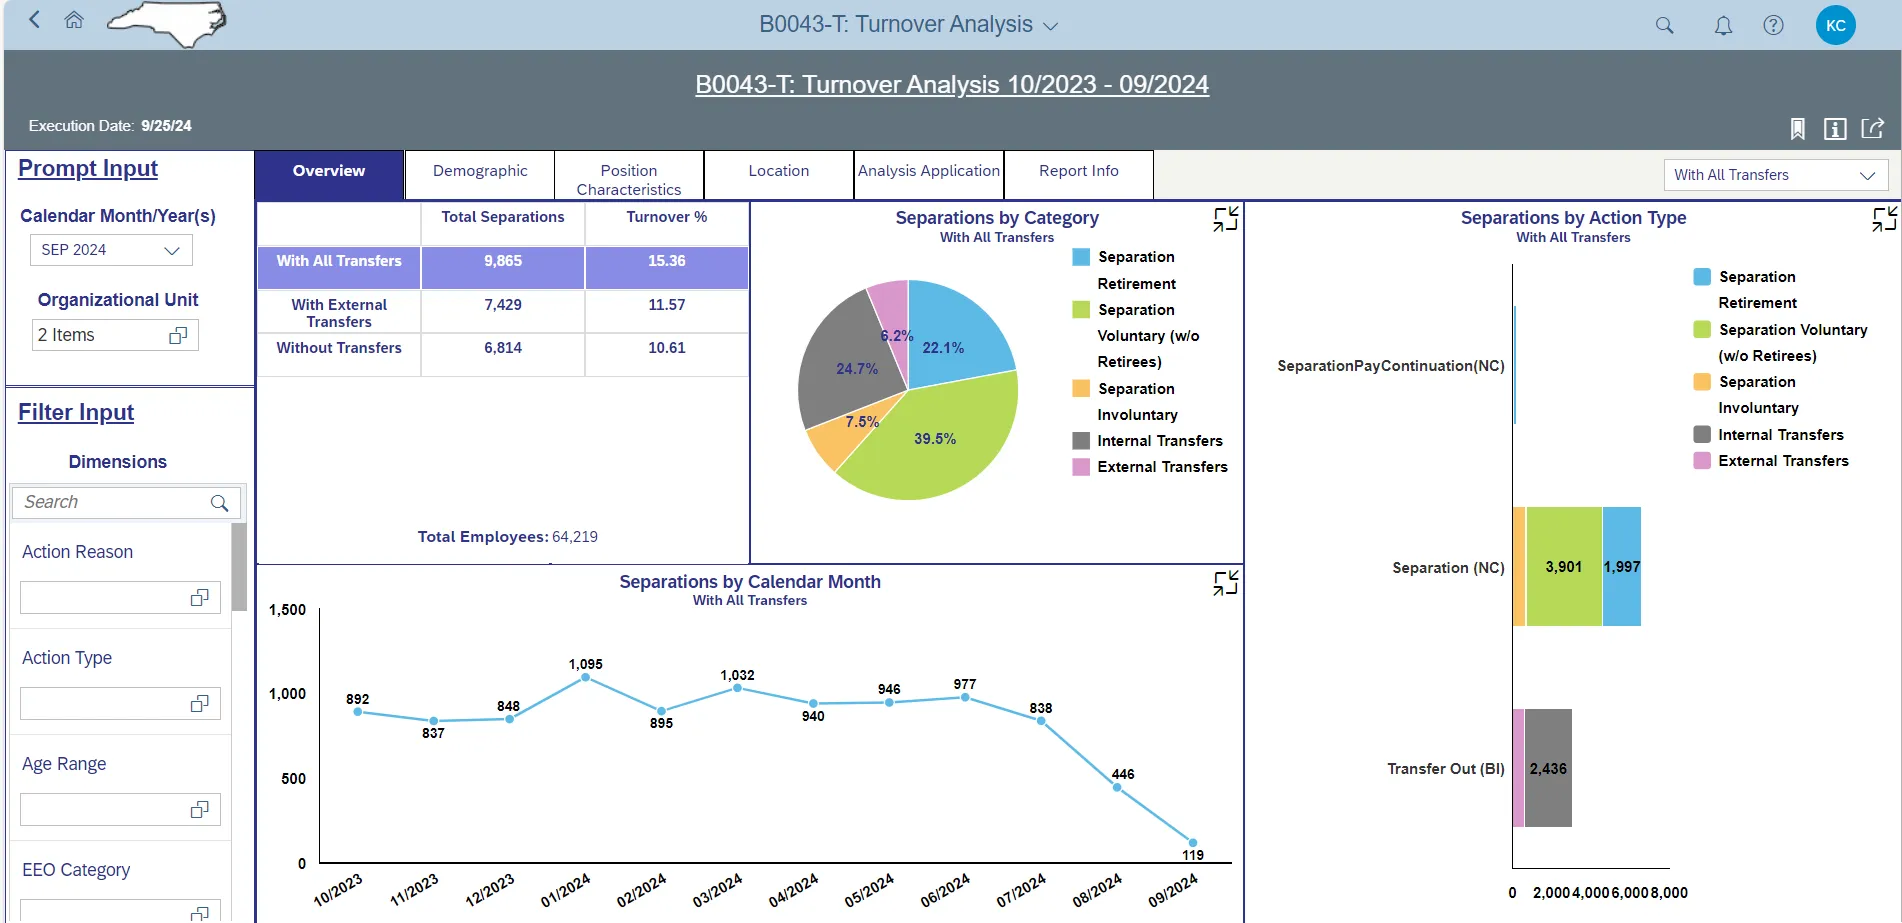
Three charts under the Overview tab provide Separation metrics by Category, Action Type, and Calendar Month besides Total Turnover.
This is a sample of the dashboard charts under the Overview tab:
Demographic Tab
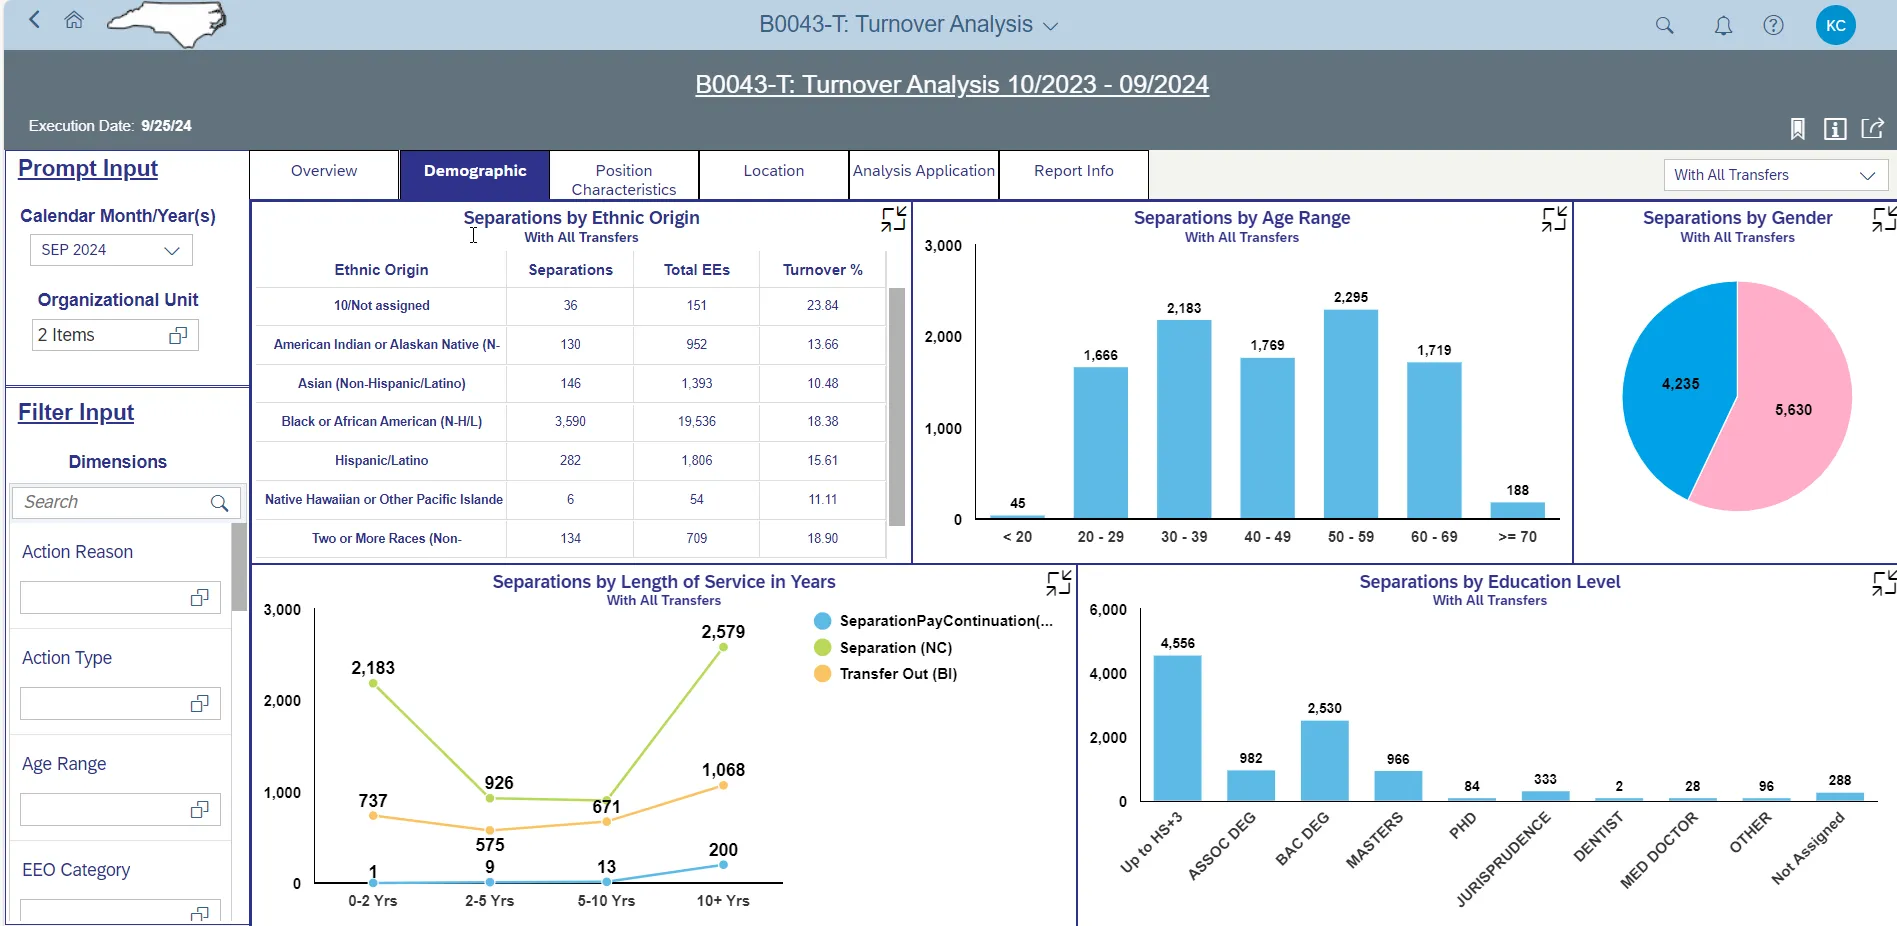
Four charts and a Crosstab/Worksheet under the Demographic tab provide Separation metrics by Ethnic Origin, Age Range, Gender, Length of Service, and Education Level.
This is a sample of the dashboard charts under the Demographic tab:
Position Characteristics Tab
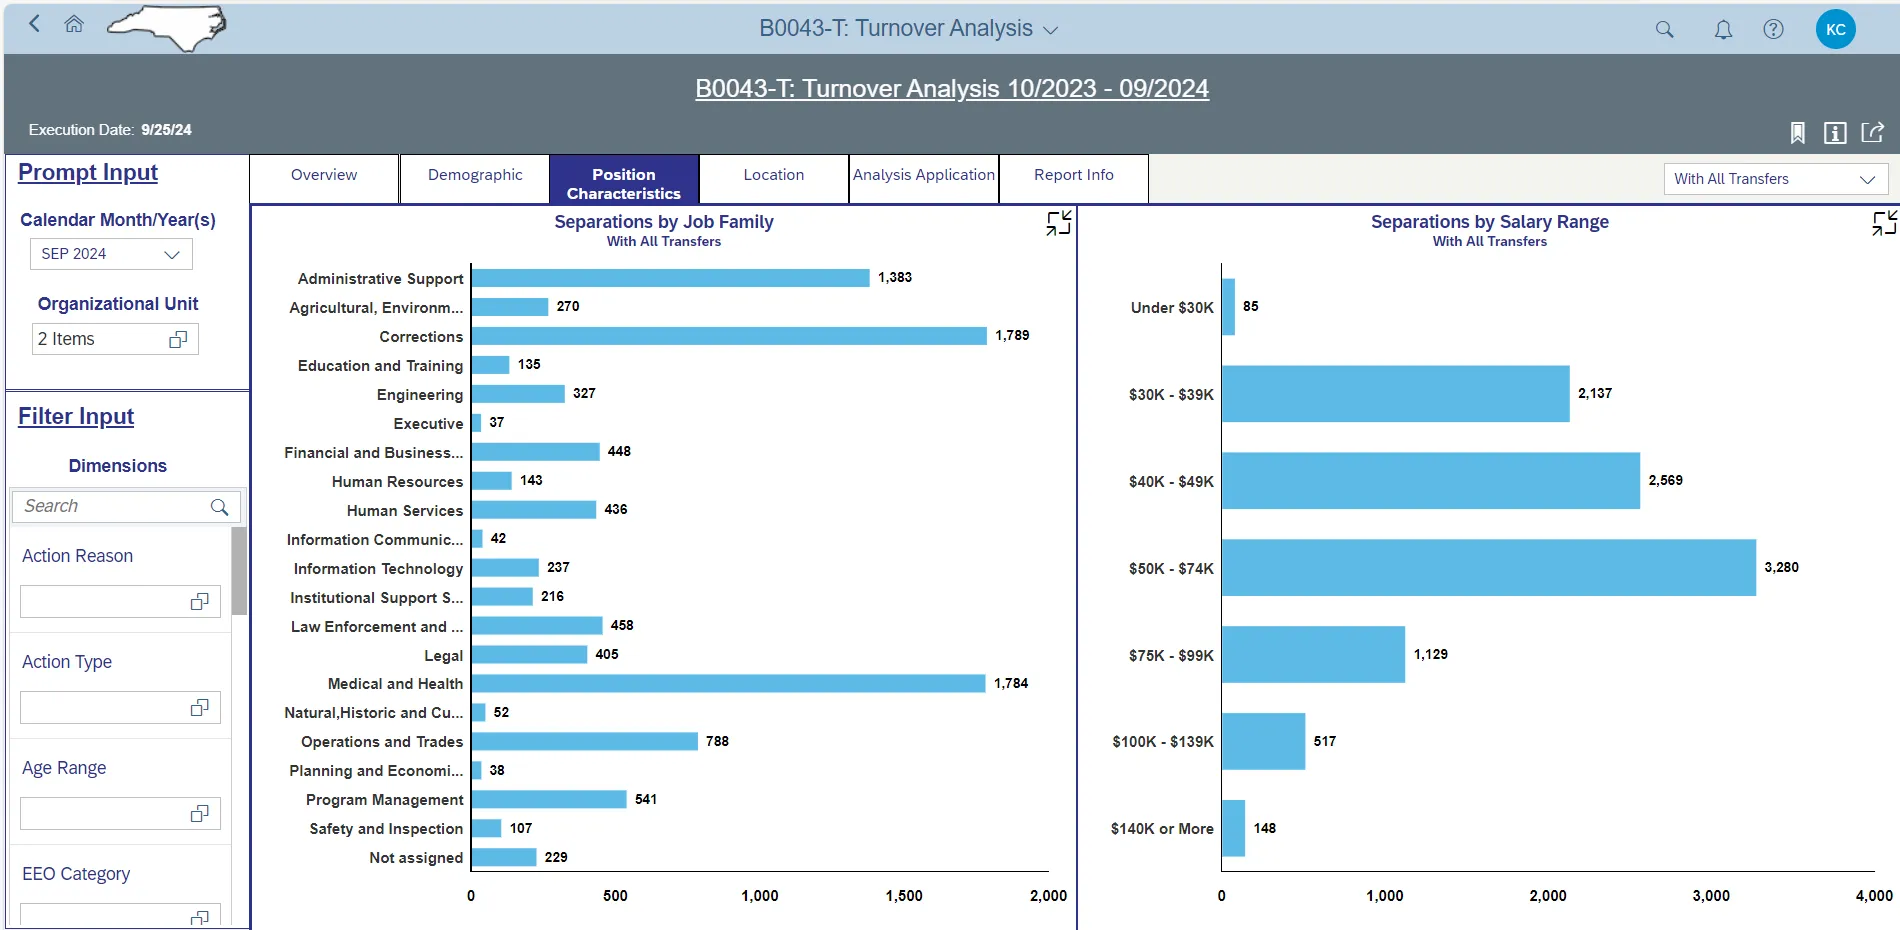
Two charts under the Position Characteristics tab provide Separation metrics by Job Family and Salary Range.
This is a sample of the dashboard charts under the Position Characteristics tab:
Prompt Input Control
The turnover dashboard also can be controlled through the Prompt Input control that appears in the top left of the dashboard.
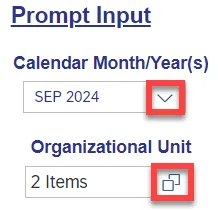
The Prompt Input has two characteristic dimensions--Calendar Month/Year(s) and Organizational Unit which are set by default in the system with an initial value.
- Calendar Month/Year(s): The default value is set to current month. User can change the value using the dropdown by clicking at the downward arrow.
- Organizational Unit: The default value is the top-level Organizational Unit to which the user has access. User can change the value by clicking the icon at the end.
Filter Input Control
The turnover dashboard also can be controlled through the Filter Input control that appears in the bottom left of the dashboard.
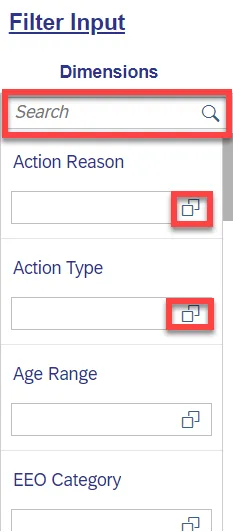
The Filter Input has many characteristic dimensions like Action Reason, Action Type, Age Range, EEO Category, etc.
- Filter values applied in this Filter Input control are applied to all the metrics displayed across all the tabs including Analysis Application tab. User can change the values of any dimension by clicking the icon at the end.
- Search: The Search box in the Filter Input is to search for specific dimension in the Filter Input control.
- Dimension List in this control are: Action Reason, Action Type, Age Range, EEO Category, Educational Est., Ethnic Origin, Gender, Job, Job Branch, Job Family, Length of Service, OrgPath – Agency, OrgPath – Division, Personnel Area, Salary Range, SOC Code, State SOC Category, and State SOC Subcategory.
Separations Dropdown Control
The turnover dashboard also can be controlled through a dropdown that appears in the top right corner of the dashboards.
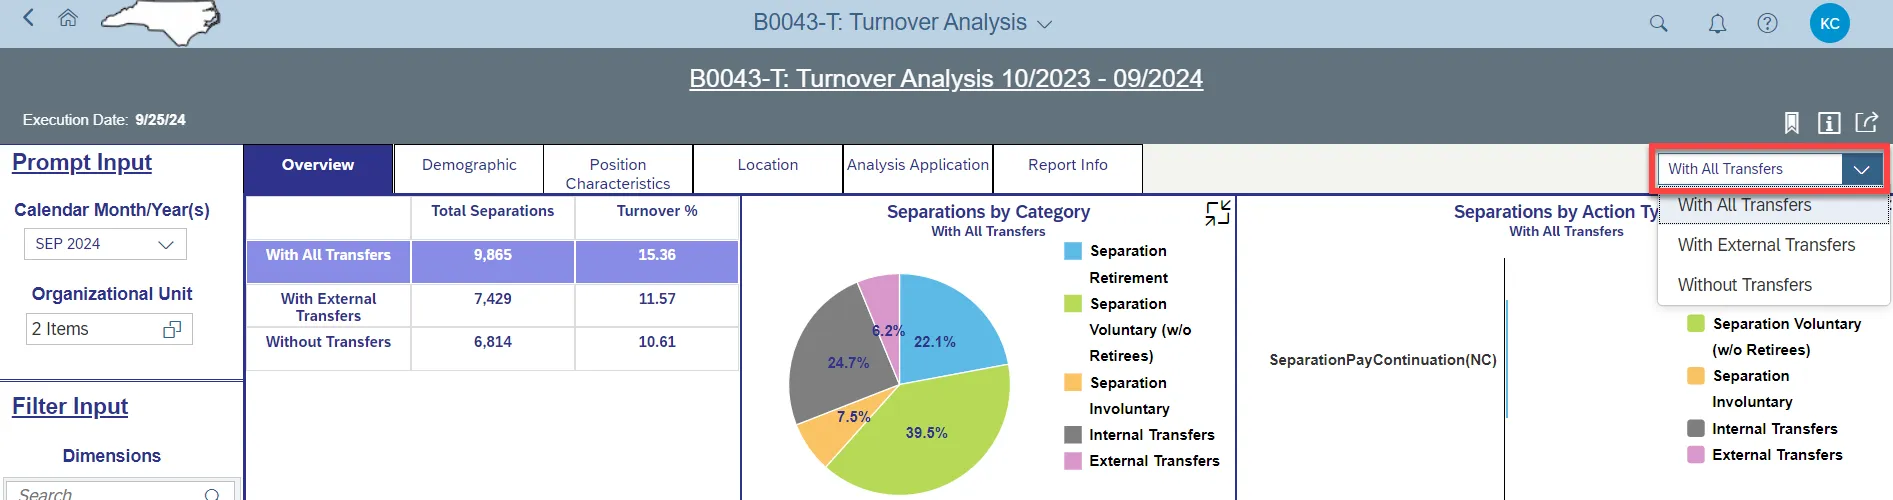
The dropdown has three values:
- ‘With All Transfers’ – Turnover includes separations and all types of transfers including internal and external transfers. This is the default dropdown selection.
- ‘With External Transfers’ – Turnover includes separations and external transfers.
- ‘Without Transfers’ – Separation only.
Based on this selection, all the turnover charts and data shown in all three tabs: Overview, Demographic and Position Characteristic, will get filtered data in the measures/metrics shown.
Report Chart Descriptions
Overview Tab
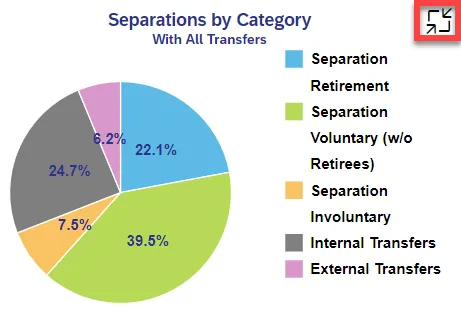
The pie chart appears in the middle of the dashboard displays the total Separations by Category like Voluntary, Involuntary, Retirement Separations, Internal Transfers, or External Transfers.
- Voluntary Separations: The percent of voluntary separations to the overall total display within the pie piece.
- Involuntary Separations: The percent of involuntary separations to the overall total display within the pie piece.
- Retirement Separations: The percent of retirement separations to the overall total display within the pie piece.
- Internal Transfers: The percent of internal transfers to the overall total display within the pie piece.
- External Transfers: The percent of external transfers to the overall total display within the pie piece.
- An enlarged full-page view of the chart can be seen by clicking at the icon at the top right corner of the chart.
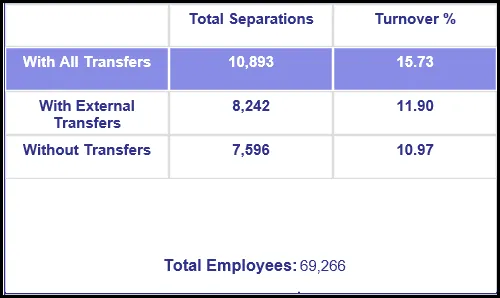
The tabular chart appears on the top left of the dashboard displays the Total Turnover in the last 12 months (including the current month).
- The chart includes the total separations, the turnover rate, and the number of employees by ‘With All transfers’, ‘With External Transfers’, and ‘Without Transfers’.
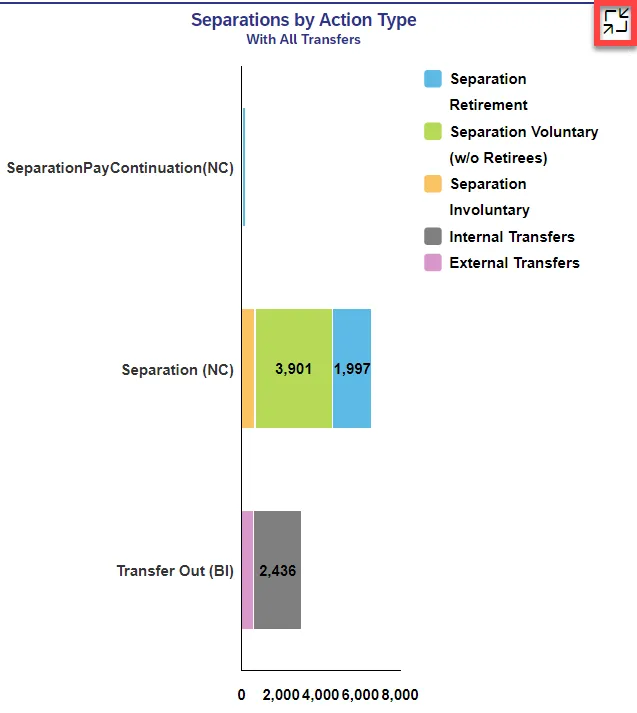
The Stacked Horizontal Column chart appears in the right of the dashboard and displays the total Separations like Voluntary, Involuntary, Retirement Separations, Internal Transfers, or External Transfers by Action Type.
- An enlarged full-page view of the chart can be seen by clicking the icon at the top right corner of the chart.
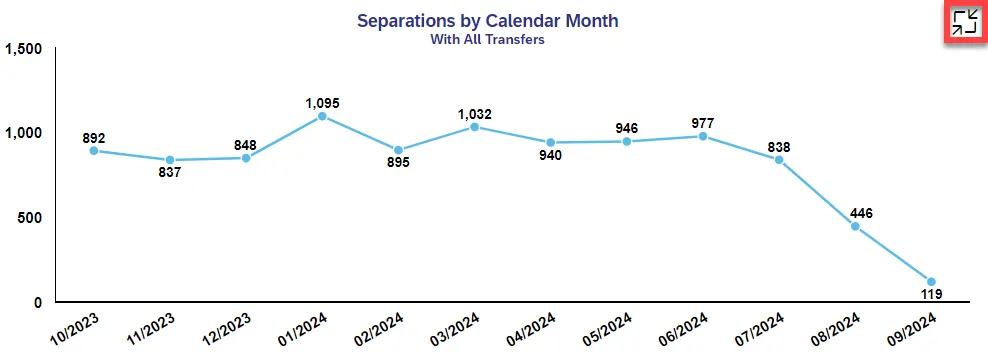
The Line chart appears at the bottom of the dashboard displays the total Separations like Voluntary, Involuntary, Retirement Separations, Internal Transfers, or External Transfers by Calendar Month.
- An enlarged full-page view of the chart can be seen by clicking the icon at the top right corner of the chart.
Demographic Tab
The tabular chart appears on the top left of the dashboard displays the Total Turnover, Total Employees, and Turnover Rate by Ethnicity.
- The chart includes the total separations, the turnover rate, and the number of employees by Ethnicity.
- An enlarged full-page view of the chart can be seen by clicking at the icon at the top right corner of the chart.
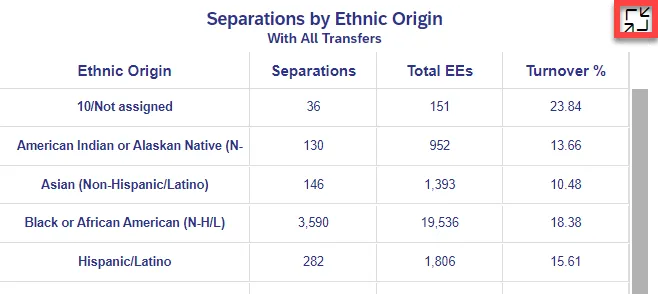
- The enlarged detail view displays the Separations and Total Employees in a bar chart with the trend line on Turnover Rate.

- Click on Close at the top right corner to return to the original dashboard page or click on the Demographic tab or other tabs to navigate out of this view.
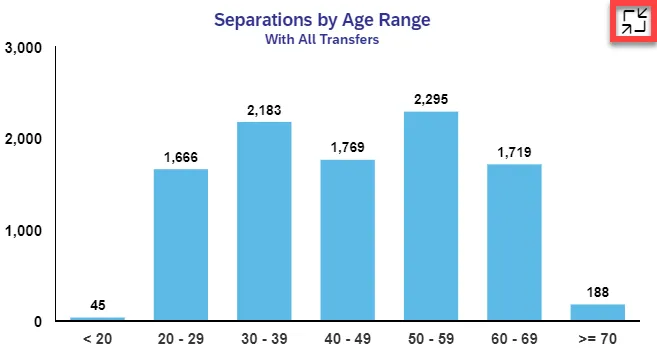
The Bar chart appears in the middle of the dashboard displays the total Separations by Age Range.
- An enlarged full-page view of the chart can be seen by clicking the icon at the top right corner of the chart.
The pie chart appears on the right of the dashboard and displays the total Separations by Gender, blue being Male and Pink or Purple being Female.
- An enlarged full-page view of the chart can be seen by clicking the icon at the top right corner of the chart.

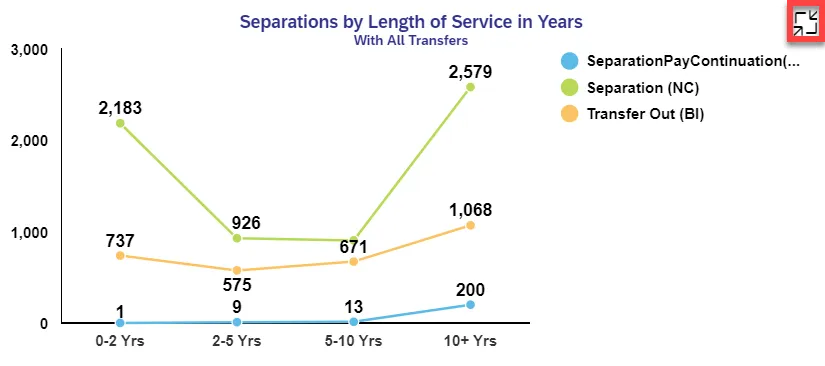
The Line chart appears in the bottom left of the dashboard displays the total Separations by Length of Service in Years.
- An enlarged full-page view of the chart can be seen by clicking the icon at the top right corner of the chart.
The Bar chart appears in the bottom right of the dashboard displays the total Separations by Education Level.
- An enlarged full-page view of the chart can be seen by clicking the icon at the top right corner of the chart.

Position Characteristics Tab
The Position Characteristics tab has two charts:
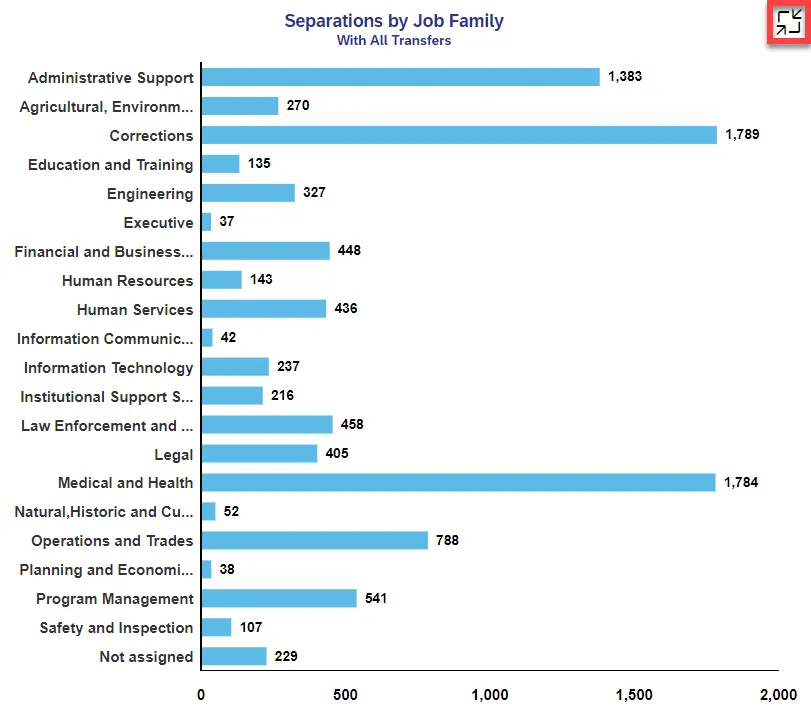
- Separations by Job Family: Horizontal Bar chart depicting number of separations for each Job Family.
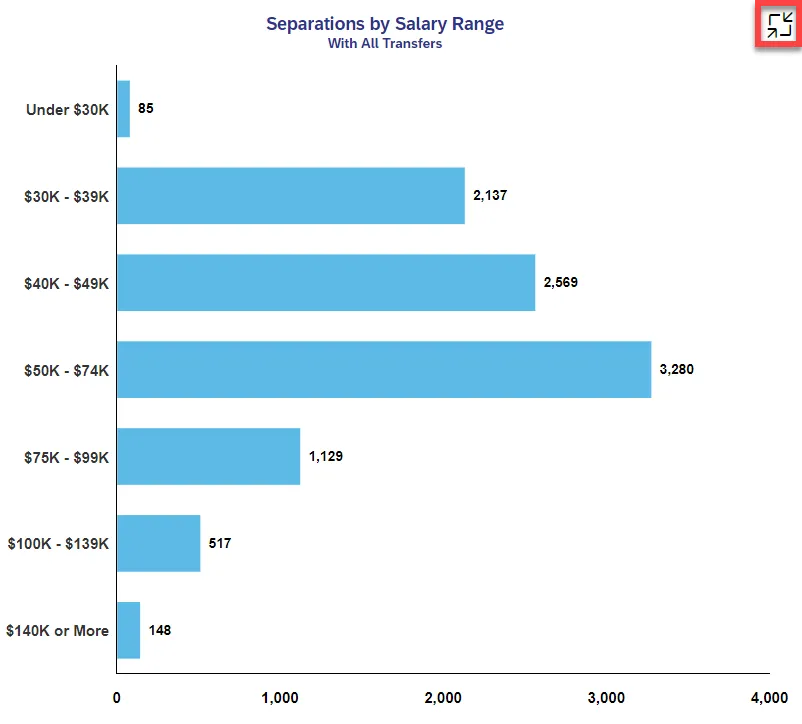
- Separations by Salary Range: Vertical Bar chart depicting number of separations for each different Salary Range.
The Horizontal Bar chart appears in the left of the dashboard and displays the total Separations by Job Family.
- An enlarged full-page view of the chart can be seen by clicking at the icon at the top right corner of the chart.
The Horizontal Bar chart appears in the right of the dashboard and displays the total Separations by Salary Range.
- An enlarged full-page view of the chart can be seen by clicking the icon at the top right corner of the chart.
Location Tab
The turnover numbers are shown for North Carolina county wise in a map in Location tab.
- The sample County wise map will look like this:
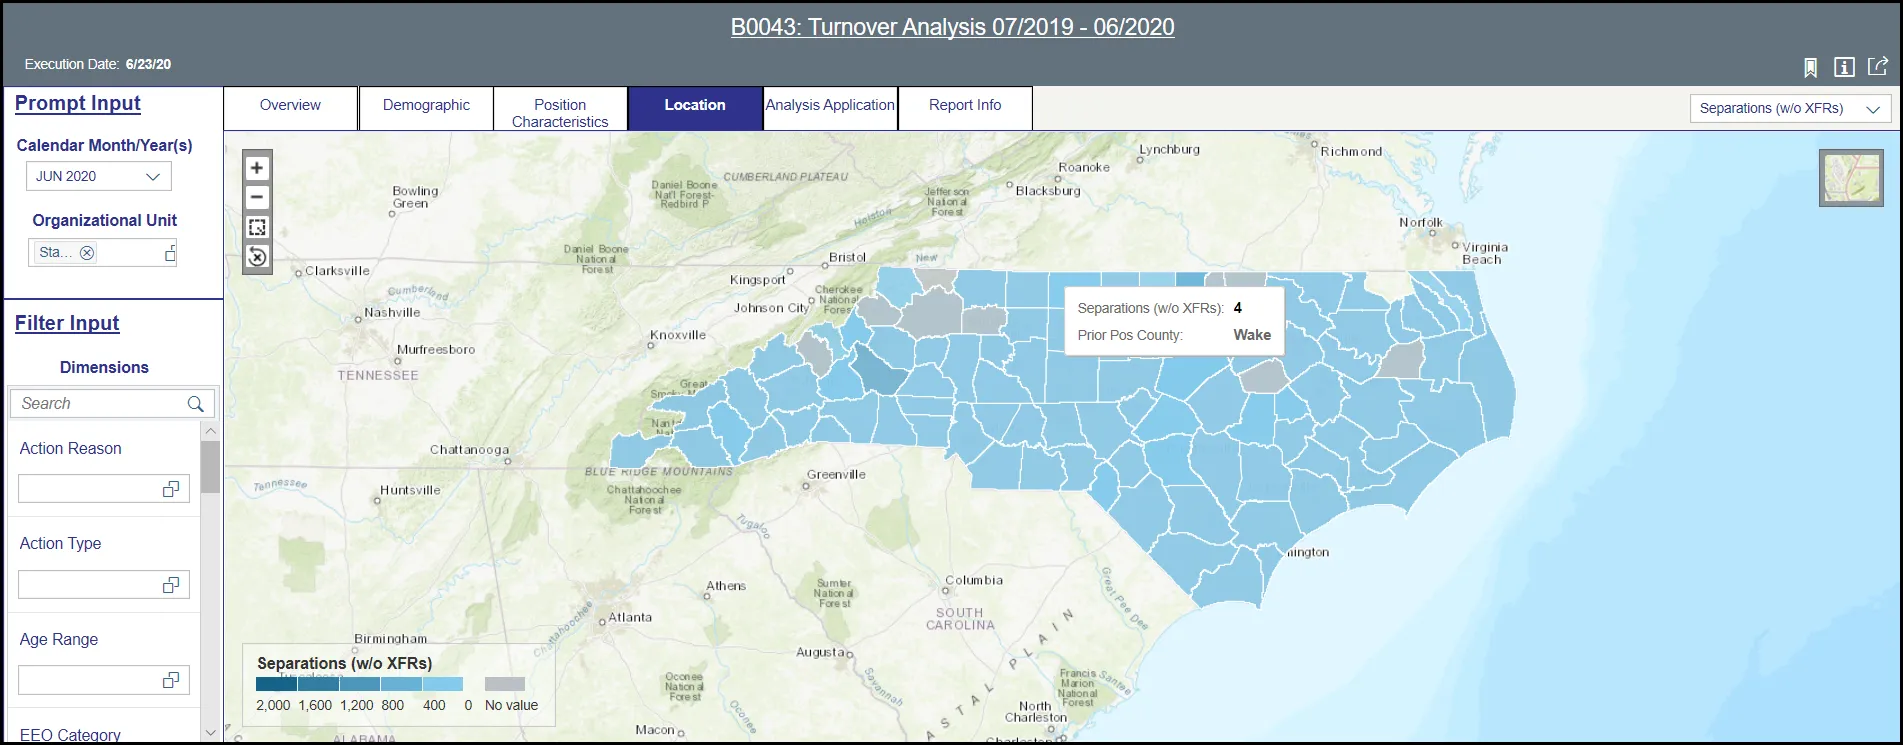
- Zoom In, Zoom Out of the map is possible with the controls ‘+’ and ‘–‘ at the top left of the map or through mouse control scroll.
- No other further drill down on the county map is available now.
- Dropdown control at the far-right corner controls only the turnover metric shown in the map in Location Tab alone. This dropdown will not have any effect on any other metrics shown in other tabs like Overview, Demographic, Position Characteristic, etc.
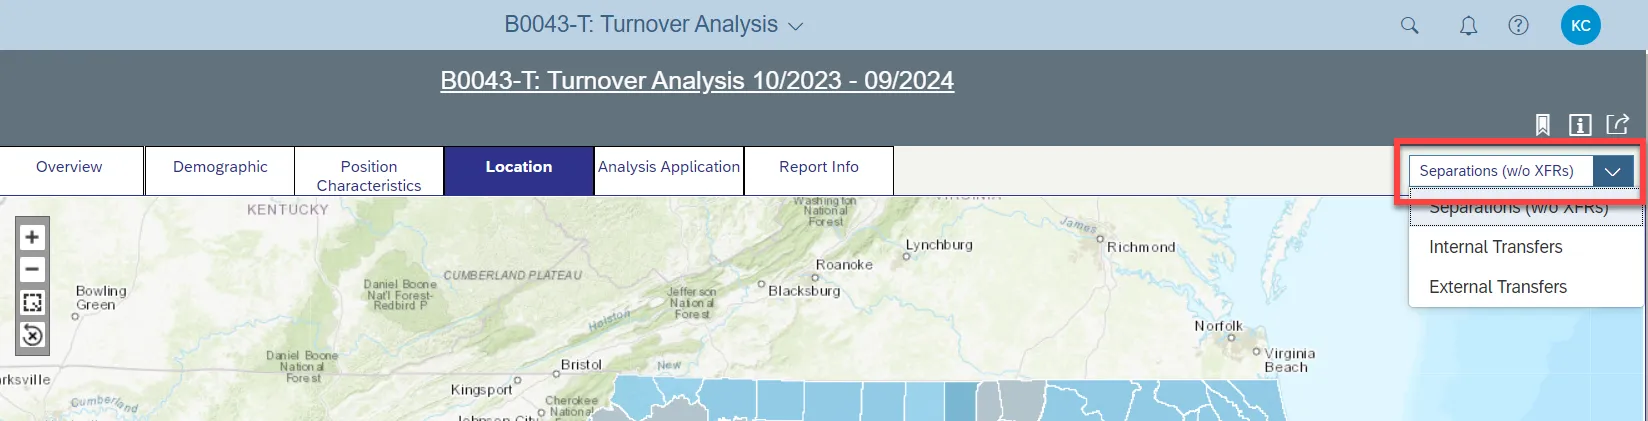
- The dropdown has three values:
- ‘Separations (w/o XFRs)’ – Turnover includes separations from state government. This is the default dropdown selection.
- ‘Internal Transfers’ – Position transfers within the Organization.
- ‘External Transfers’ – Separation transfers to other agencies.
Analysis Application Tab
Analysis Application tab is a user interactive tool to manipulate the data and the table on the workspace to customize to their needs.
- The sample will look like this:
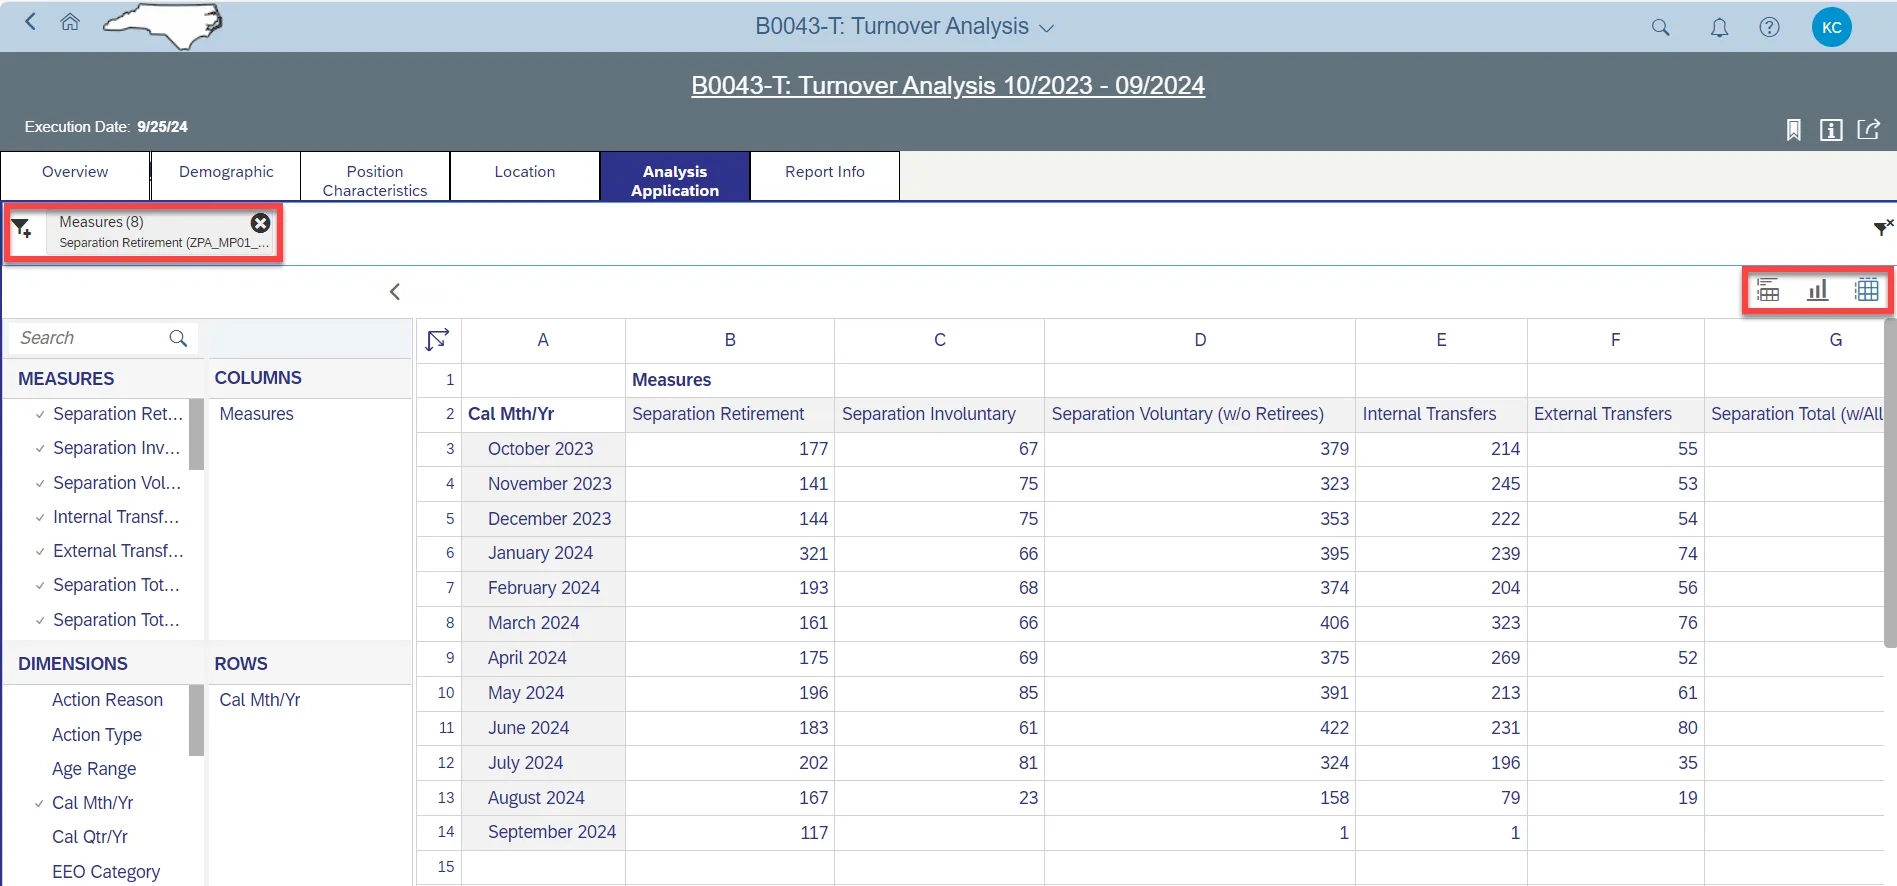
- Users can drag the dimensions and measures to Rows and/or Columns to see a customized table or chart.
- List of measures given here are good representation of the measures shown in other tabs. Not all the measures are listed here as some are customized in the backend query to suit a chart and fearing this may cause inaccuracies in other measures when customized here.
Special Report Considerations/Features
- Temporary and Hourly employees are excluded.
- The Number of Employees metric is based on the count of active employees for the current month (at the time that the data is refreshed).
- Turnover Rate is calculated as Total Separations divided by Number of Employees.
- The Separation categories are defined based on Action Type and Action Reason:
| Action Type | Action Type Desc. | Action Reason | Action Reason Desc. | Separation Categories |
|---|---|---|---|---|
| ZF | SeparationPayContinuation(NC) | 1 | Retirement LEO Supplement | Retirement - Voluntary |
| ZF | SeparationPayContinuation(NC) | 2 | RIFSeverance and/or Health Ins | Involuntary |
| ZF | SeparationPayContinuation(NC) | 4 | Separation ShortTermDisability | Involuntary |
| ZF | SeparationPayContinuation(NC) | 5 | RTR-RIF | Voluntary |
| ZG | Separation (NC) | 1 | Better Employment | Voluntary |
| ZG | Separation (NC) | 2 | Personal Reasons | Voluntary |
| ZG | Separation (NC) | 3 | Involuntary Separation | Involuntary |
| ZG | Separation (NC) | 4 | Did Not Report | Exclude |
| ZG | Separation (NC) | 5 | Voluntary Resigned W/O Notice | Voluntary |
| ZG | Separation (NC) | 6 | RIF w/no Severance/Health Ins | Involuntary |
| ZG | Separation (NC) | 7 | No Reason Given | Voluntary |
| ZG | Separation (NC) | 8 | Long Term Disability | Involuntary |
| ZG | Separation (NC) | 9 | Retirement | Retirement - Voluntary |
| ZG | Separation (NC) | 10 | Retirement Disability | Retirement - Voluntary |
| ZG | Separation (NC) | 11 | Contract Ended | Involuntary |
| ZG | Separation (NC) | 12 | Time-Limited Appt Term | Involuntary |
| ZG | Separation (NC) | 13 | Supplemental Appt Term | Involuntary |
| ZG | Separation (NC) | 14 | Appointment Ended | Involuntary |
| ZG | Separation (NC) | 15 | Not Re-Elected | Involuntary |
| ZG | Separation (NC) | 16 | Dismissed-Gross Inefficiency | Involuntary |
| ZG | Separation (NC) | 17 | Dismissed-Conduct | Involuntary |
| ZG | Separation (NC) | 18 | Dismissed-Unsat Performance | Involuntary |
| ZG | Separation (NC) | 2- | Prior to achieving Perm status | Involuntary |
| ZG | Separation (NC) | 21 | Pay in lieu of notice | Involuntary |
| ZG | Separation (NC) | 22 | Death | Voluntary |
| ZG | Separation (NC) | 23 | Other | Voluntary |
| ZG | Separation (NC) | 24 | Terminate while on FMLA | Voluntary |
| ZG | Separation (NC) | 25 | Beacon to Non-Beacon Agency | Voluntary |
| ZG | Separation (NC) | 26 | Cancel Sep Pay Continuation | Exclude |
| ZG | Separation (NC) | 27 | Removal From Office - AOC Only | Involuntary |
| ZG | Separation (NC) | 28 | RIF Discontinue Service Retire | Retirement - Voluntary |
| ZG | Separation (NC) | 29 | Unavailable to Work | Involuntary |
| ZG | Separation (NC) | 40 | 115C Dismissal | Involuntary |
| ZG | Separation (NC) | 50 | RTR | Voluntary |
| ZG | Separation (NC) | 52 | RTR-Retire | Retirement - Voluntary |
- A Bookmark can be set and used through the following option in the top right corner.

- The info icon displays the information about the dashboard.
- Dashboard data can be exported to an Excel or as a CSV file or Print to PDF from the respective tabs by choosing the appropriate icons at the top right corner of the dashboard.
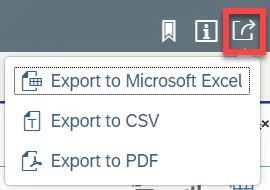
- Export to PDF will export only the current tab.